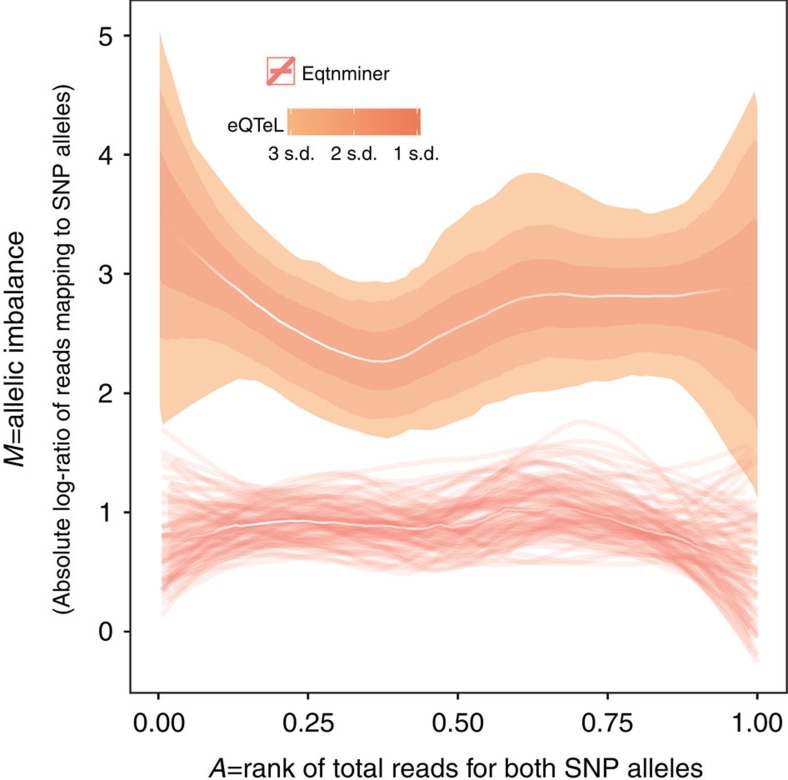
Figure 6. DNAse hypersensitivity at eeSNPs shows greater allele specificity in HCM.
X axis: rank of DHS read counts, Y axis: absolute log-ratio of read counts mapping to the two alleles at a SNP. SNPs from different methods are selected similarly to Fig. 5. The analysis was performed on a subset of SNPs that were heterozygous in the sample. The median "white" lines represent LOESS (local regression) for each method. Confidence intervals for each median line is estimated using bootstrapping and are represented either by thin lines representing the LOESS of each bootstrap or by coloured shades representing confidence intervals in terms of standard deviation of bootstraps. Note the allele-specificity at SNPs detected by eQTeL and eqtnminer remains the same even if we control for number of SNPs per gene.

