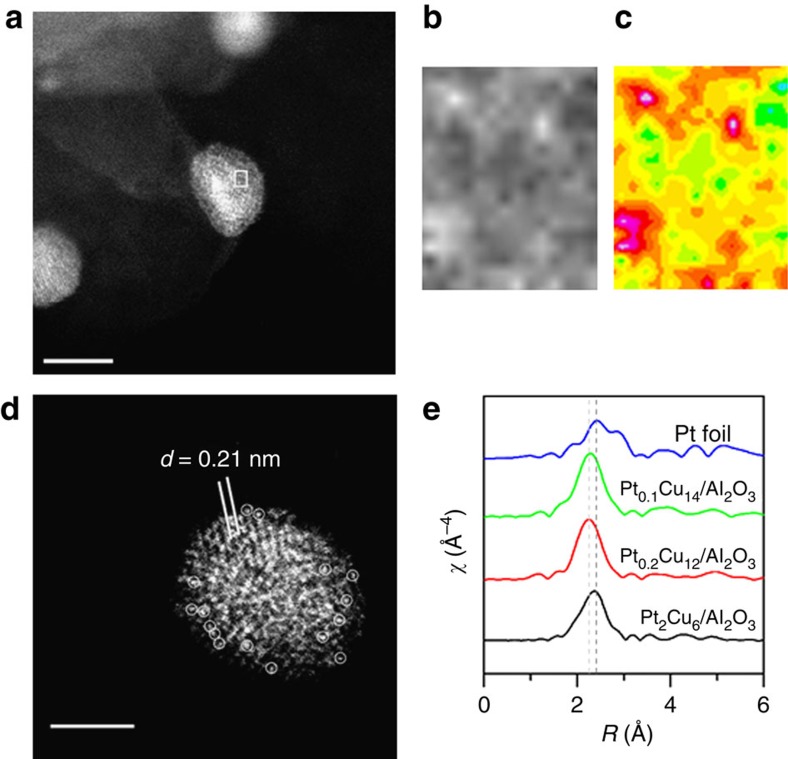
Figure 5. Characterization of Pt/Cu SAA NPs.
(a–d) HAADF-STEM images with (c) coloured intensity map from selected region, and (e) EXAFS k3-weighted Fourier transforms. (a,d) Typical regions of the sample Pt0.1Cu14/Al2O3, showing Cu metal particles with isolated Pt atoms. Isolated Pt atoms are highlighted with circles. The lattice spacing of Cu is 0.21 nm. Scale bars, 5 nm (a) and 2 nm (d). (b) Enlarged image and (c) colorized intensity map of highlighted region showing isolated Pt atoms. (e) EXAFS data were collected at Pt-LIII edge at room temperature from Pt foil and in H2 atmosphere at Pt-LIII edge at room temperature from pre-reduced Pt0.1Cu14/Al2O3, Pt0.2Cu12/Al2O3 and Pt2Cu6/Al2O3.

