
Figure 4.
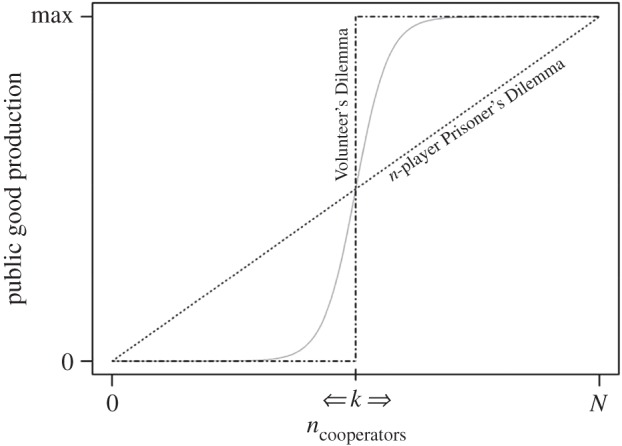
Schematic of the difference between the production functions of the n-player Prisoner's Dilemma (dotted line) and the Volunteer's Dilemma (dashed-dotted line). In the former, there is a linear relationship between the number of group members that cooperate and the likelihood (or amount) of the public good that is produced, whereas in the latter public good production is modelled by a step-function: the public good is only produced if the number of cooperators exceeds a critical threshold, k. The solid grey curve depicts a biologically more realistic, and intermediate scenario (such as communal range defence) between these two extreme scenarios. Theoretical work suggests that these intermediate production curves are often mathematically more accurately approximated by the Volunteer's Dilemma than by the n-player Prisoner's Dilemma [63], and our analyses on individual-level participation in aggressive between-group encounters in a focal population of vervet monkeys add empirical support to this.