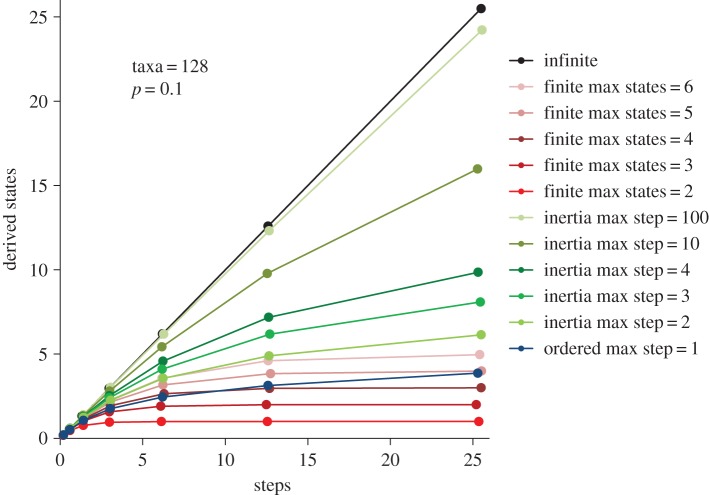
Figure 1.
The average number of derived states (M) versus evolutionary steps (S) per character evolved cumulatively up a phylogeny under different computer models of character evolution (see table 1 for model parameters). Simulations were conducted on perfectly balanced trees with 128 terminal taxa, for 100 characters, with a probability of state change of p = 0.1 on any given branch. Plotted values are the average across 20 independent simulations.

