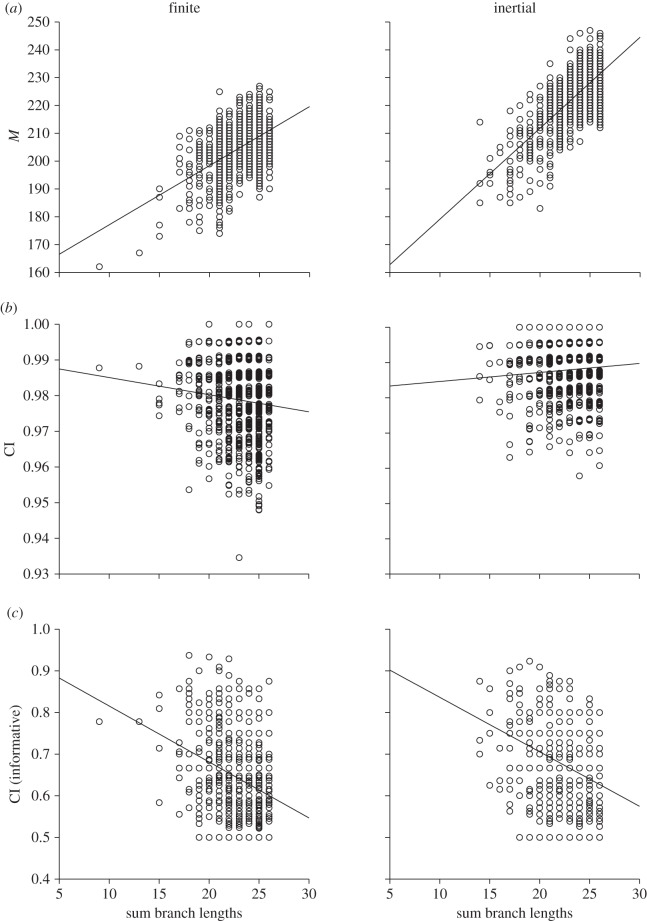
Figure 3.
Phylogenetic rarefaction plots for simulated character data. Derived states and homoplasy indices measured for four-taxon subtrees sampled from a compete tree of 128 taxa, under a finite state space model (with six states) versus an inertial state space model (with a maximum step size of 2). (a) Numbers of derived states among 100 characters (M). (b) Consistency index (CI) calculated across all characters. (c) Consistency index calculated with parsimony uninformative characters excluded. The x-axis indicates the phylogenetic relatedness of the sampled taxa (total branch length of the sampled subtree). Probability of state change = 0.3. Data points shown for 1000 sampled subtrees.

