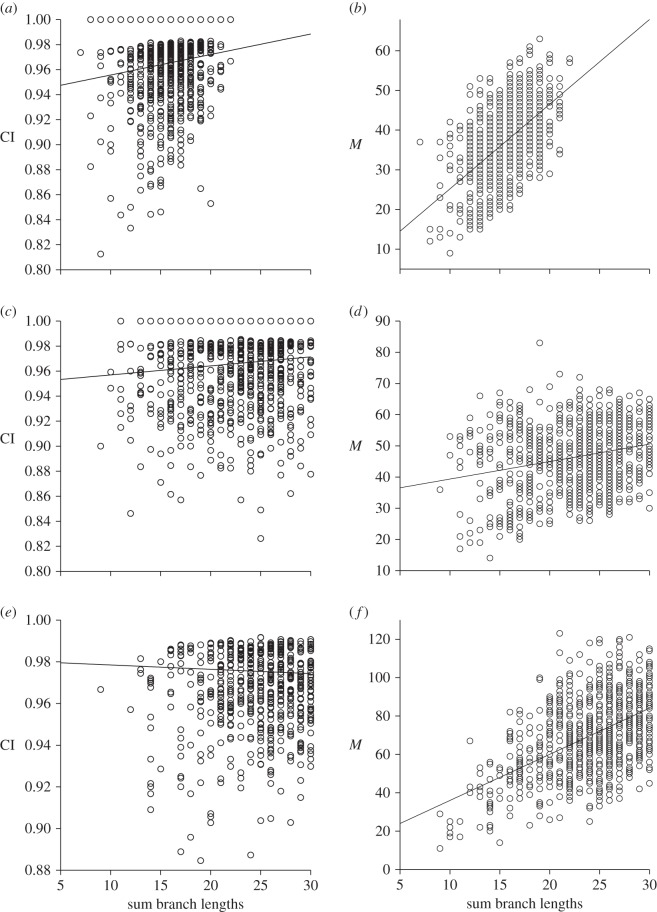
Figure 4.
Phylogenetic rarefaction plots for real morphological character data. Consistency indices (CI) and numbers of derived states (M) measured for 1000 four-taxon subtrees sampled from complete phylogenies. Phylogenies based on reanalysis of published morphological character matrices of (a,b) dicynodonts [35], (c,d) ptychoparioid trilobites [42] and (e,f) crocodilians [39]. See table 3 for statistical results.

