
Figure 2.
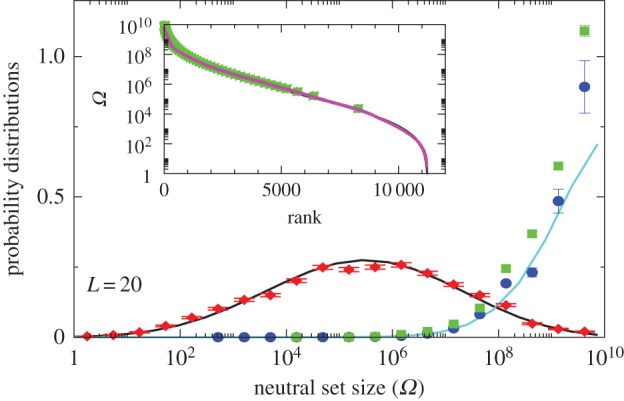
Comparison of P-sampled and G-sampled distributions to natural data for L = 20 RNA. The P-sampled PP(Ω) (red diamonds) measures the probability distribution for a phenotype to have a given NS size Ω. It differs markedly from G-sampled PG(Ω) (blue circles), generated by random sampling over genotypes. Error bars arise from binning data. The black and cyan lines are theoretical approximations to PP(Ω) and PG(Ω), respectively (see Methods). The probability distribution of Ω for the SSs all 7327 (non-trivial) L = 20 sequences for Drosophila melanogaster from the fRNAdb database [21] (green squares) is much closer to the G-sampled PG(Ω) than to the P-sampled PP(Ω). Inset: all 11 218 SS phenotypes (purple triangles) ranked by NS size Ω. There is strong bias, just 5% of phenotypes take up 58% of all genotypes. The 7327 natural data points (green squares) are clustered at lower rank (larger Ω). (Online version in colour.)