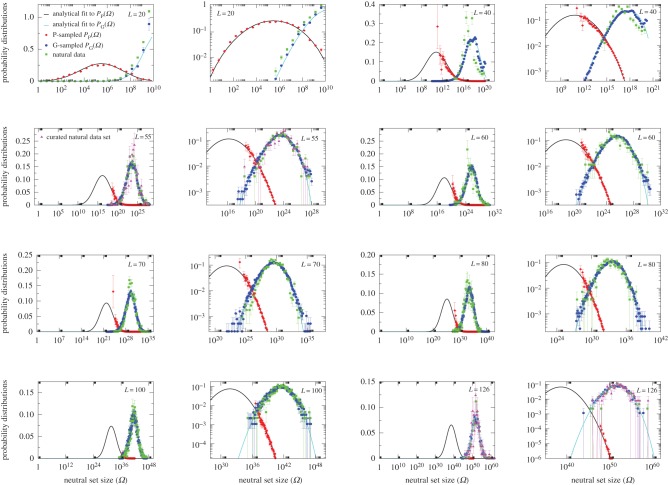
Figure 3.
Neutral set size distributions illustrate how bias constrains natural RNA secondary structures. Sampled distributions PP(Ω) (red diamonds) and PG(Ω) (blue circles) and analytic approximations to PP(Ω) (black lines) and PG(Ω) (cyan lines) are compared with ncRNA from the fRNAdb database [21] (green squares). For each length (denoted in the top corners), the data are shown both on a lin–log and log–log graph to highlight different parts of the distributions. The natural data are remarkably close to the G-sampled PG(Ω), but quite far from the P-sampled PP(Ω). The number of natural structures plotted are 7327 for L = 20 (which is repeated from figure 2 for clarity of comparison); 658 for L = 40; 472 for L = 50; 350 for L = 60; 2263 for L = 70; 553 for L = 80; 731 for L = 90; 891 for L = 100; and 291 for L = 126. In each case, all structures in the fRNAdb [21] database are used, except for L = 20, where only structures for Drosophila melanogaster are used, and for L = 55 and L = 126, where we also plot a smaller curated dataset of 213 and 172 structures, respectively (magenta triangles), where the SS is known to be important (see electronic supplementary material). Smaller numbers of data lead to larger binning error bars, but the curated sets are clearly very similar to the full set of fRNAdb structures. (Online version in colour.)

