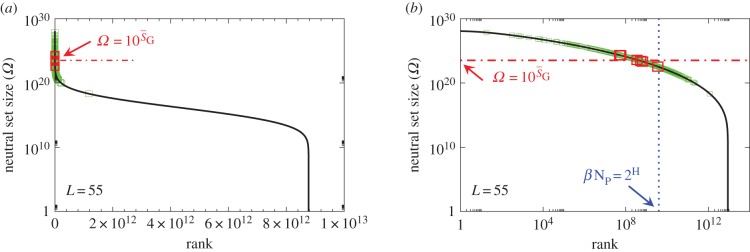
Figure 4.
Ω versus rank plot for all  possible SS structures for L = 55 shown as (a) log–lin and (b) log–log plots. The black line is from the analytical approximation and the green squares denote the natural data. The horizontal red dotted-dashed line is
  near the peak of the PG(Ω) distribution for L = 55 in figure 3. The 13 L = 55 hammerhead ribozyme structures from the fRNA database (red squares) are clustered near this peak. The vertical blue dotted line in (b) denotes
  the ‘effective’ number of SSs. This set of
  of all structures captures the majority (≈75%) of natural structures. (Online version in colour.)

