
Figure 5.

Natural stack distributions for ncRNA correlate with G-sampling but not with P-sampling. (a) Distribution of the number of stacks for L = 55 via G-sampling (blue circles) and P-sampling (black diamonds). Natural data (green squares) are remarkably close to the G-sampled distribution, and are drawn from a tiny fraction of the full morphospace of structures (the P-sampled distribution) with small numbers of stacks. The red diamonds are from a combinatorial estimate of stack number [30] that helps corroborate our P-sampling result. (b) Comparison with experimentally measured structures: the brown squares denote the number of stacks experimentally determined for 214 non-pseudo-knotted structures with L > 20 which were taken from the RNA STRAND database [29]. The cyan diamonds show  the mean number of stacks calculated by G-sampling with the Vienna package [10], which can be accurately fitted with
 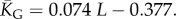 The blue diamonds show the G-sampled number of stacks 1 s.d. above or below the mean. The natural data (brown squares) from the RNA STRAND database are consistent with the G-sampled theoretical data. By contrast these natural data are far away from the expected number of stacks from P-sampling, shown here for an estimate that uses the linear relationship between the P-sampled distribution of log(Ω) and K (electronic supplementary material, figure S6) to infer
  (red diamonds), which are well described by a linear fit
  (solid red line). Independent estimates of
  come from [30], and include an asymptotic measure
  (dashed-dotted line) (see electronic supplementary material). The close agreement between the two independent methods for estimating the mean number of stacks from P-sampling gives us further confidence in our fits to the full P-sampled distribution. (Online version in colour.)