
Figure 6.
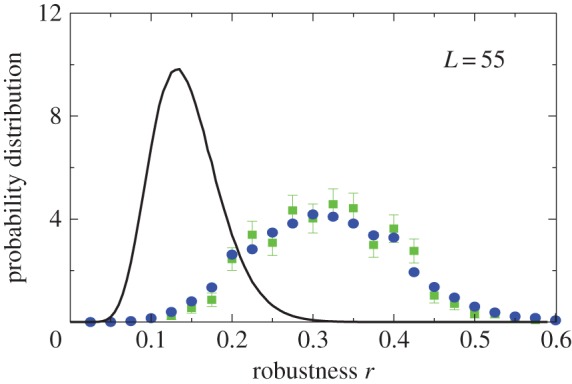
Natural robustness distributions for ncRNA correlate with G-sampling but not with P-sampling. The distribution of robustness, defined as the fraction of mutations r that retain the same SS phenotype, is given for L = 55 via P-sampling (black line) and G-sampling (blue circles). Natural data (green squares) are remarkably close to the G-sampled distribution, and are considerably more robust than the average of structures in the full morphospace. We also note that most phenotypes have a robustness that is above the threshold ( ) needed for the formation of connected neutral networks [31]. (Online version in colour.)