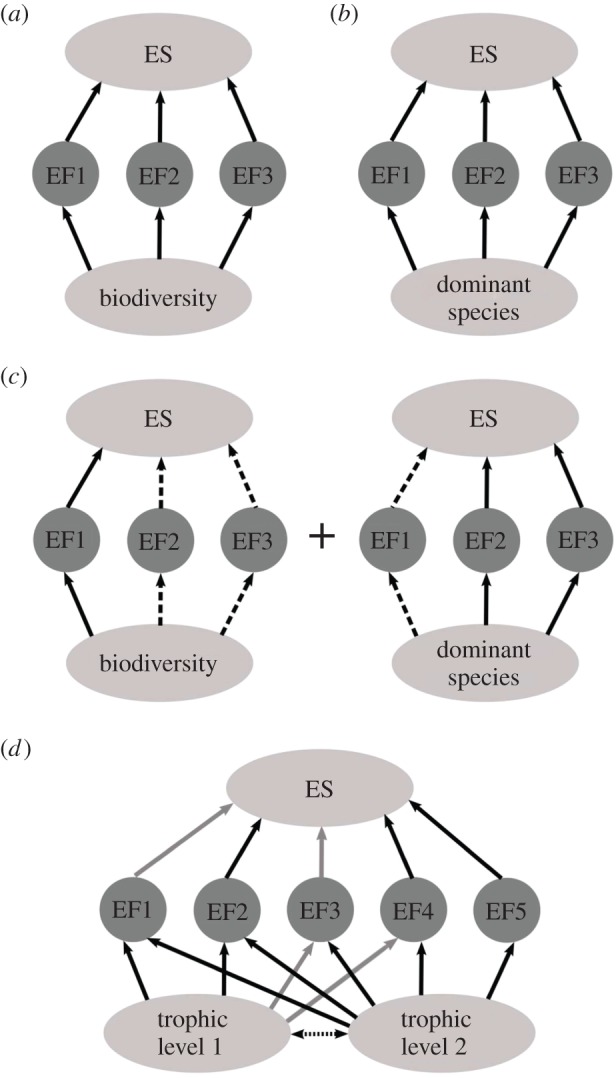
Figure 3.

Hypothetical variation in B–EF–ES relationships (see also [18]) as driven by the main contributing EFs (within an EF portfolio). Black arrows refer to positive effects (dashed arrows displaying less strong effects) while grey arrows refer to negative effects.
