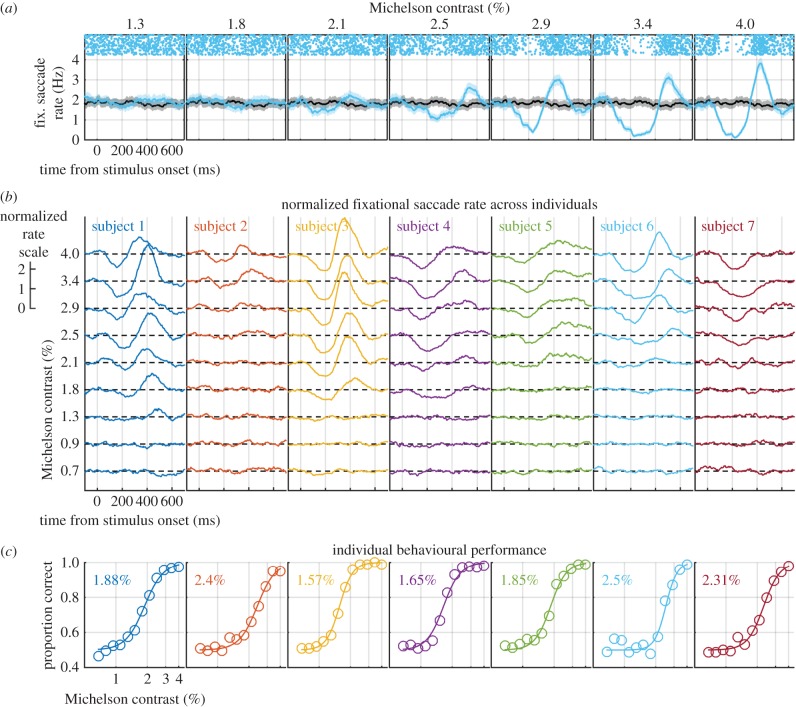
Figure 1.
Fixational saccade rate and psychophysical performance vary as a function of small changes in stimulus contrast. (a) Fixational saccade rate (computed from passive trials) as a function of time since stimulus onset for subject 6. Solid blue lines show the mean rate at the contrast indicated above each panel and solid black lines the mean rate for the no stimulus condition, with shaded regions indicating 95% confidence intervals. Raster plots at the top of each panel show fixational saccade events from 30 trials per line. (b) Fixational saccade rates normalized to the baseline condition with each of the seven subjects represented in different colours. Note the variability in the lowest contrast at which the rate signature becomes apparent. (c) Proportion correct contrast detection performance from trials in which subjects were prompted to respond. Data were fitted with a logistic function and thresholds (75% correct) are indicated in each panel.

