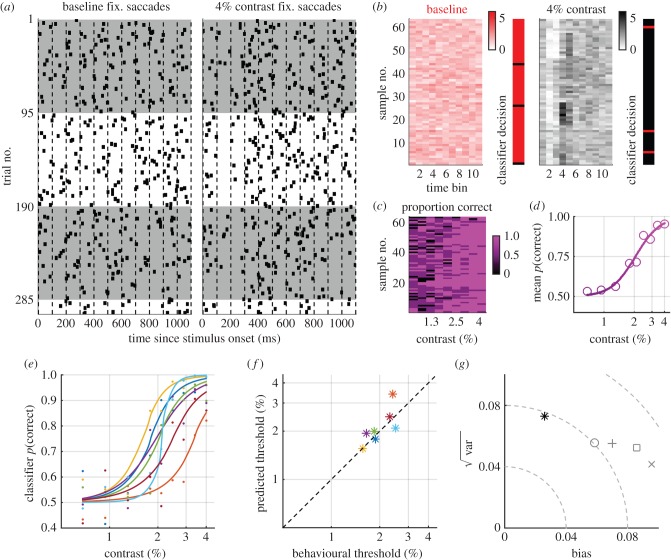
Figure 3.
Thresholds predicted from a support vector classifier exhibit lower error and less bias than those predicted from rate signature features. (a) Raw saccade events for the baseline (no stimulus) and 4% contrast conditions, indicating how the trials were down-sampled across time (dashed lines) and trial (white and grey shading). For clarity one example is shown, but results are based on 1000 non-parametric bootstraps. (b) Samples input to the classifier after down-sampling; the rate signature can be observed in most samples in the 4% data. The classifier decision for each left-out sample from each group in the cross-validation indicates that the classifier discriminated the correct group for all but six samples, three for each group. (c) Percentage correct calculated from the classifier decisions for each paired sample from the baseline and stimulus groups. (d) Mean population percentage correct, fitted with a logistic function. (e) Mean classifier performance computed when left-out samples belonged to each subject, fitted with logistic functions. (f) Thresholds from the logistic fits plotted against behavioural thresholds. (g) Bias, root variance and RMSE for the classifier (asterisk) and for the rate signature features (grey symbols: refer to figure 2).

