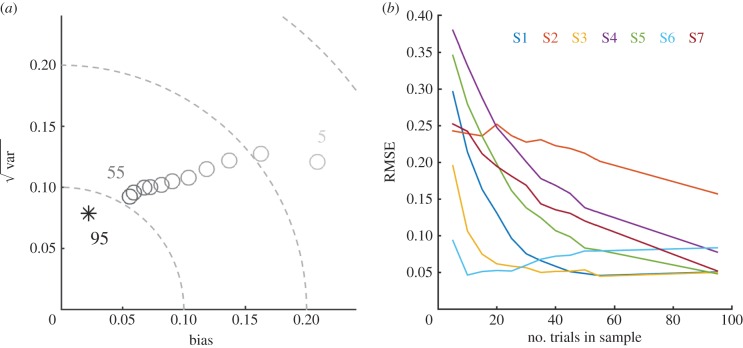
Figure 6.
The effect of reducing the total amount of data on prediction error. (a) Each point refers to a different number of trials per sample (limited to 10 samples per individual) with darker shades indicating more trials. The asterisk from the original classifier is included for comparison. RMSE and positive bias increase as the amount of data decreases and there is also an increase in the percentage of fits rejected (not shown). (b) Inter-individual variability in the relationship between the number of trials per sample and the RMSE.

