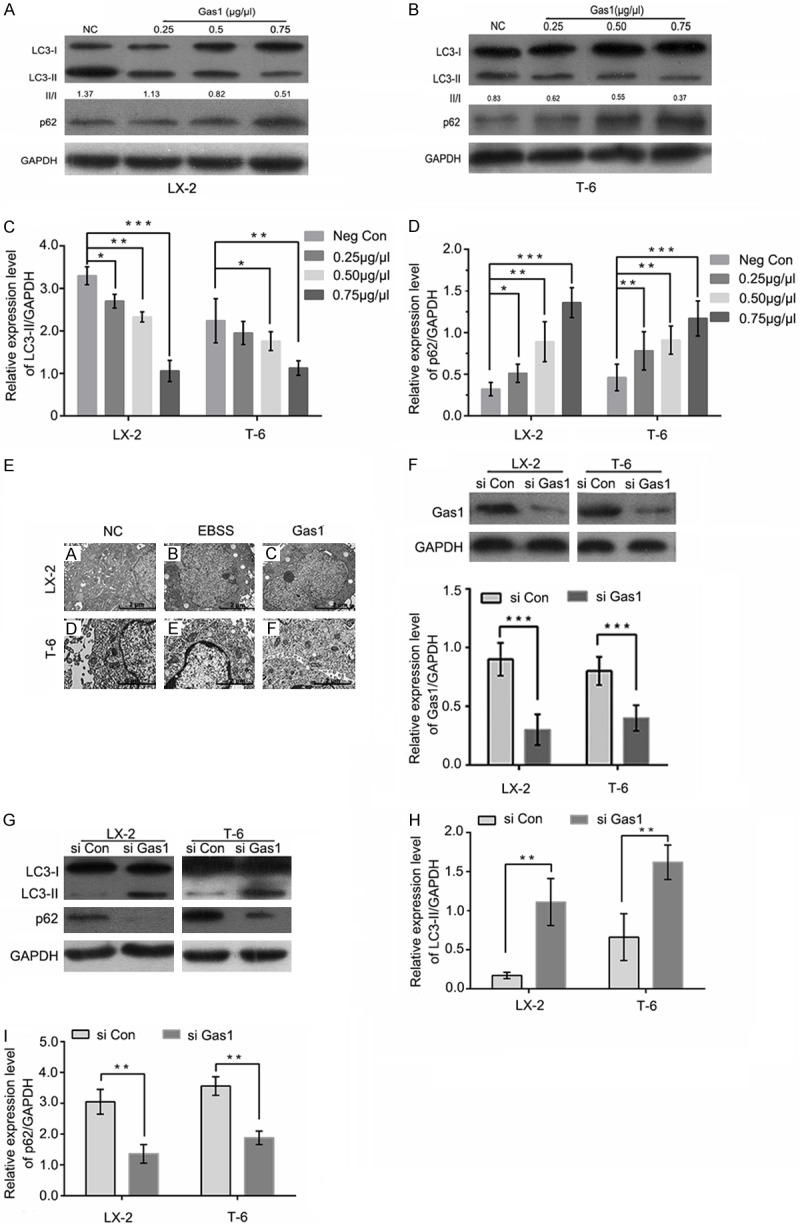
Figure 3.

Gas1 inhibits autophagy in LX-2 and T-6 cells. (A and B) LX-2 and T-6 cells were pretreated with EBSS for 4 h. After 48 h of treatment with different concentrations of Gas1 or the negative control, western blotting was performed to detect LC3B and p62 levels, and the densitometry of LC3-II normalized to GAPDH is labeled under each lane. The changes in autophagic flux are shown in (C and D) respectively. Gas1 expression decreased starvation-induced LC3-I to LC3-II conversion and inhibited SQSTM1/p62 degradation in a dose-dependent manner. GAPDH was used as a loading control. (E) The ultrastructures of LX-2 and T-6 cells were analyzed by transmission electron microscopy (TEM). The cells were treated with EBSS for 4 h prior to the addition of 0.75 μg/μl Gas1. TEM images show autophagic vacuoles containing organelles and lamellar, vesicular structures. Control sample received no Gas1 treatment (Scale bars, 2 µm, and 10,000 × direct magnification). (F) LX-2 and T-6 cells were transfected with specific siRNAs for Gas1 and lysed after 72 h. Western blotting showed that Gas1 siRNA could knock down protein expression with high efficiency. (G and I) LX-2 and T-6 cells were treated in the absence or presence of Gas1 siRNA for 72 h. LC3-II and p62 expression levels were analyzed by western blotting. The data are presented as the means ± SD of at least three independent experiments. *P < 0.05, **P < 0.01, ***P < 0.001, unpaired Student’s t-test, versus control group.
