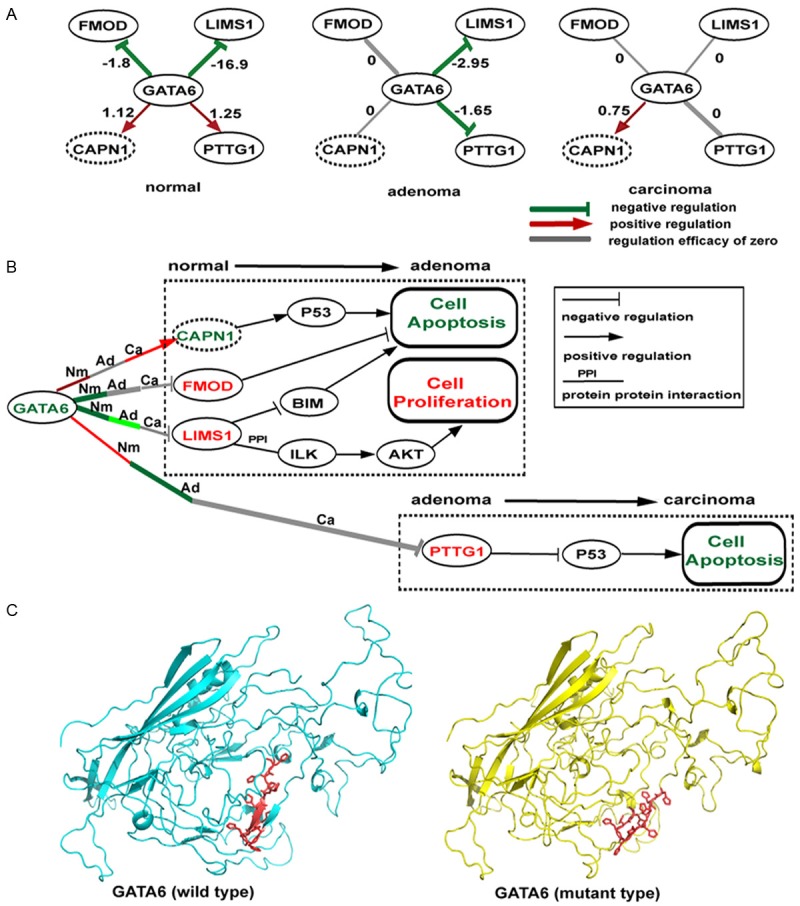
Figure 4.

The proposed dysregulation mechanisms around GATA6. A. GATA6-centered subnetworks out of the three GRNs corresponding to normal, adenoma and carcinoma. GATA6 is a TF, and the other nodes are its targets. Nodes in solid-line ovals represent DRLs related targets; nodes in dotted-line ovals are unrelated to DRLs. Links in red, green and grey represent positive, negative and absent regulation relationships calculated with dataset GES24375; links in bold are DRL related. Numbers on the links indicate the regulation efficacies. B. The proposed mechanism by which GATA6 induces gastric adenoma. Links in red, green and grey still represent positive, negative and absent regulation relationships at normal (Nm), adenoma (Ad) and carcinoma (Ca) stage calculated with dataset GES24375. The darker the color, the larger the absolute regulation efficacy. Links in black are gene-gene interconnections obtained from literatures. The color of gene symbol, red or green, represents up- or down-expression in stage transition according to dataset GES24375 and TCGA data. Boxes indicate biological processes, with red color referring to activation and green color referring to inhibition. C. Homology models of normal and mutation GATA6 protein are represented in cyan cartoon and yellow cartoon, respectively. The mutated local region (residue 323-332) is shown in red.
