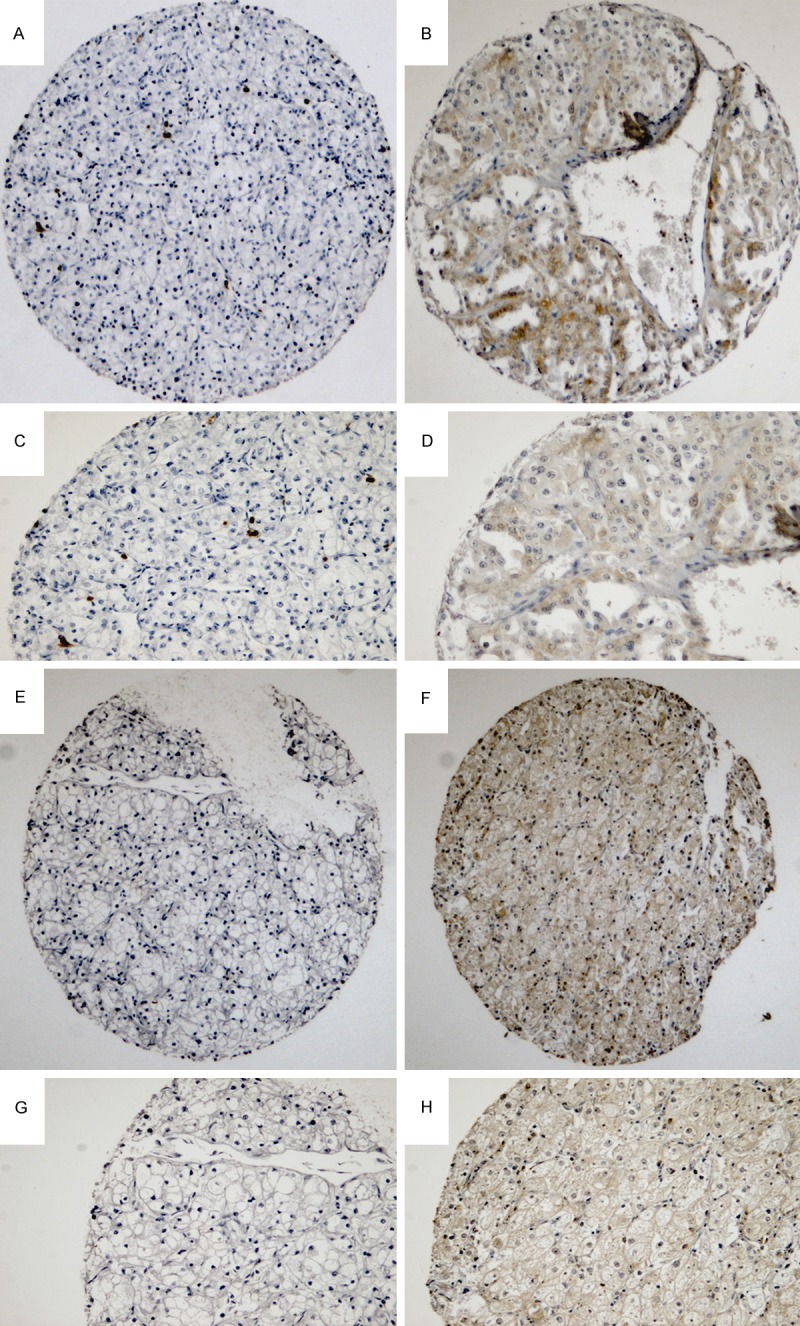
Figure 1.

Representative cores from a TMA of clinically confined clear cell renal cell carcinoma. Images demonstrate the negative and positive immunohistochemical staining pattern for p4E-BP1 (A to D) and eIF4E (E to H). Typical cores for p4E-BP1 and eIF4E are shown in low (A, B, E, F) and high magnification (C, D, G, H).
