
Figure 1.
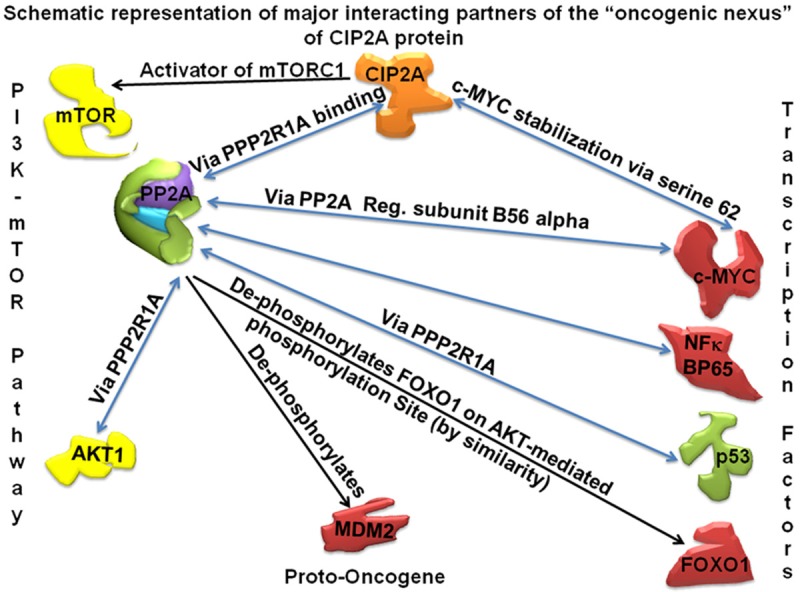
Functions and interactions of CIP2A and the “oncogenic nexus” of CIP2A are presented in a schematic representation of the major interacting partners of “oncogenic nexus” of CIP2A protein. Oncogene CIP2A is depicted in orange. Other proto-oncogenes, oncogenes and oncogenic Transcription Factors (TF) are depicted in red. Tumor suppressors genes (PP2A and p53) are depicted in green. Subunits of PP2A are schematically presented in different colors. Signaling components of the PI3K-mTOR pathway (AKT and mTOR) are depicted in yellow. Functional involvement (post-translational modifications etc) via binding of two proteins is shown in blue bidirectional arrows. Remaining functions are presented in black unidirectional arrows.