
Figure 4.
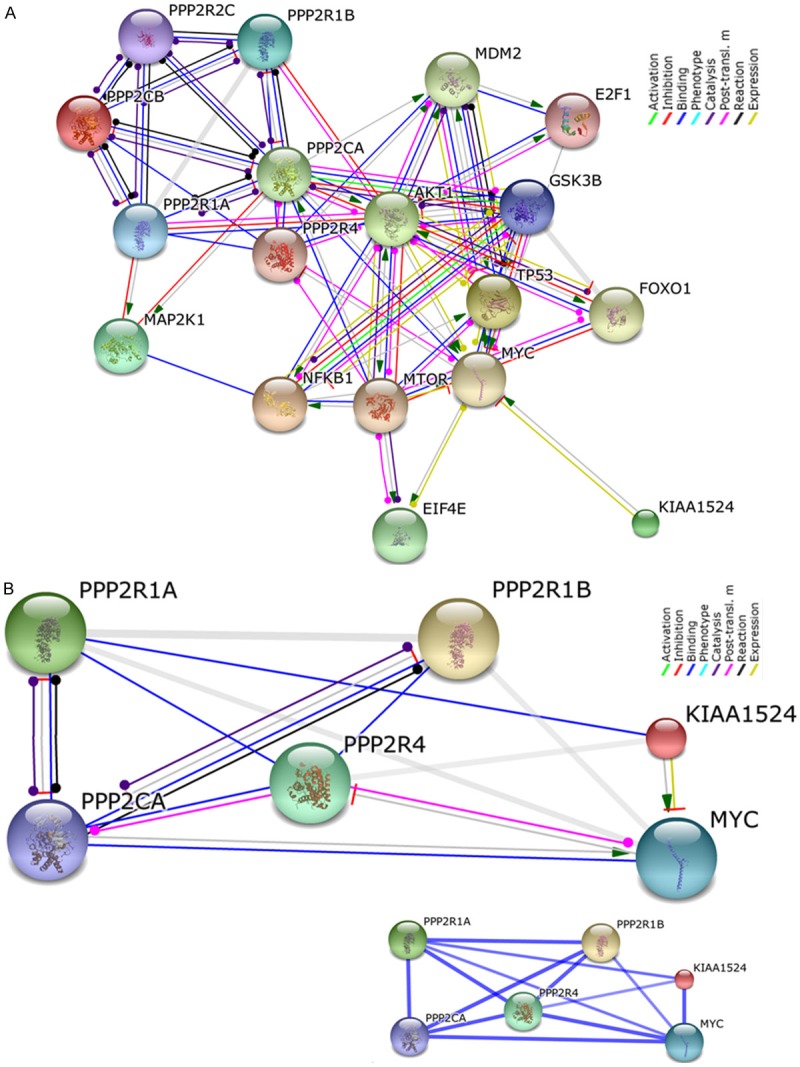
Network display of the interaction between major components of the “oncogenic nexus” of CIP2A (as represented in the Figure 1 and [1]): A. The interaction included different subunits of PP2A tumor suppressor protein, different transcription factors including MYC oncogene and the interacting components of major oncogenic pathways like PI3K-mTOR pathway as well as MAPK-ERK pathway (the details about the method of analyses are described in the text). B. Network display of the interaction between CIP2A, MYC and genes corresponding to subunits of PP2A protein, the PPP2R1A, and PPP2R1B which are mostly altered in BC. “Action View” is presented with “Confidence View” as the inset. The “input” proteins (KIAA1524, PPP2R1B, PPP2R1A, PPP2R4, MYC, and PPP2CA) were entered into STRING10 in order to find the association at the medium confidence view, 0.400. Stronger associations are represented by thicker lines. The details regarding the active prediction methods are included in the text. We acknowledge the STRING10 (Search Tool for the Retrieval of Interacting Genes/Proteins).