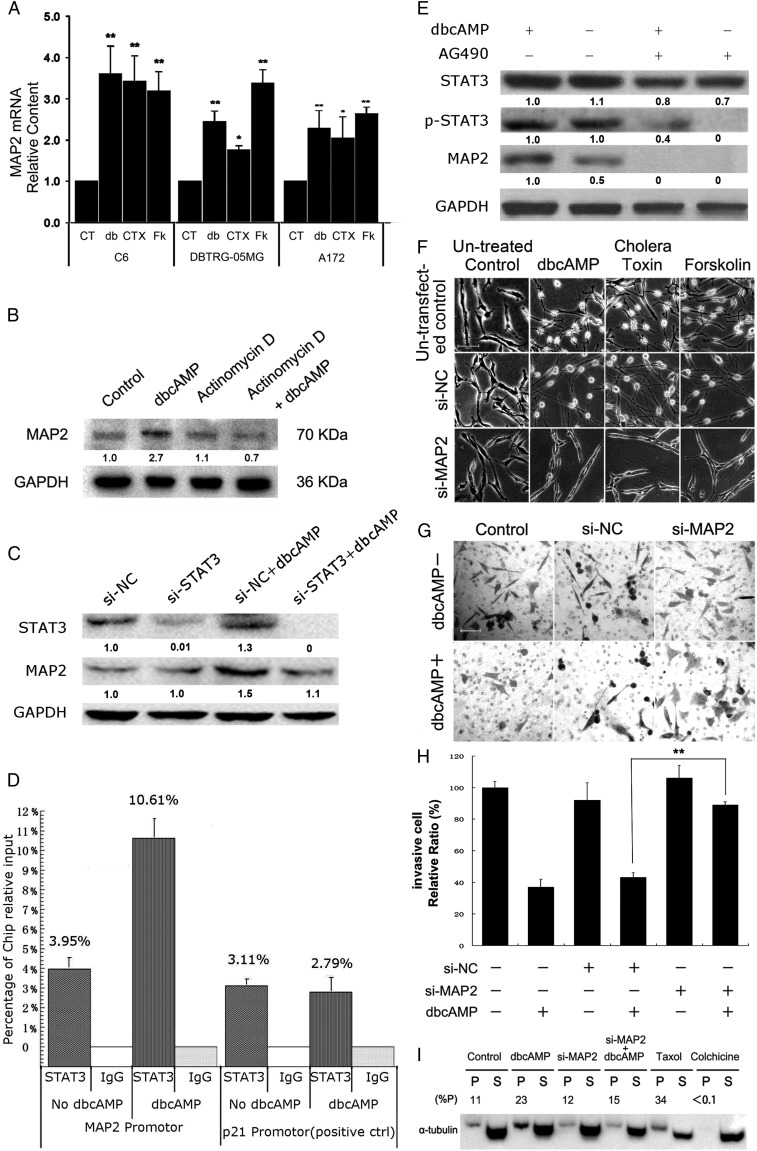
Fig. 5.
Transcriptional upregulation of MAP2 expression involved PKA-induced decreased invasion of glioma cells. (A) Relative mRNA levels of MAP2 were measured by quantitative real-time PCR after PKA activators (CT, control group; db, 1 mM dbcAMP; CTX, 10 ng/mL cholera toxin; Fk, 30 μM forskolin cholera toxin; Fk, 30 mM forskolin) treatment in C6, DBTRG-05MG, and A172 cells. (B) Global transcription of C6 cells was blocked by actinomycin D, and the protein level of MAP2 was measured with/without dbcAMP treatment. (C) siRNAs targeting STAT3 were transfected into C6 cells for 24 hours, followed by dbcAMP treatment for an additional 24 hours. Western blotting was used to quantify the protein level of MAP2. Cells were seeded at a density of 1 × 10⁵. (D) After cross-linking, DNA was sonicated and immunoprecipitated at 4°C. The DNA was then extracted from the immunoprecipitate and used for quantitative real-time PCR analysis. The chromatin immunoprecipitation analysis showed STAT3 occupancy on MAP2 target promoters in DBTRG-05MG cells with or without the treatment of dbcAMP for 24 hours. The target sequences were detected by qRT-PCR analysis of eluted DNA. The relative STAT3 occupancy over the percent input is shown as a bar chart. p21 is a positive control for STAT3 occupancy. (E) DBTRG-05MG cells (1 × 10⁶) were seeded and pretreated with JAK2 inhibitor AG490 (12.5 μM) for 2 hours and cultured with/without 1 mM dbcAMP for 24 hours. Western blotting was used to assess the protein levels of MAP2, STAT3, and phosphorylated (Tyr705) STAT3. (F) C6 glioma ells were seeded at a density of 5 × 10⁴. Scramble siRNA (si-NC) or siRNAs targeting MAP2 mRNA (si-MAP2) were transfected into C6 cells for 24 hours and then treated with/without PKA activators for an additional 48 hours. Untransfected controls were treated in the same way as mentioned above except without transfection of siRNA. Cellular morphological changes were examined (original magnification: × 200; scale bar: 100 μm). (G and H) DBTRG-05MG cells were seeded at a density of 5 × 10⁴. Cell invasion of control or MAP2-silenced DBTRG-05MG cells was examined by transwell assay, as indicated, with/without 1 mM dbcAMP treatment. (original magnification: × 100; scale bar: 100 μm). (I) C6 glioma cells were seeded at a density of 5 × 10⁴. Polymerized tubulins (named as P) in C6 cells were evaluated after MAP2 silencing for 24 hours, followed with/without an additional 48 hours of dbcAMP (1 mM) treatment. 50 ng/mL taxol or 1 μM colchicine-treated cells were harvested as the positive and negative control groups, respectively. Data are shown as the mean ± SD (n = 3). *P < .05; **P < .01; ***P < .001 compared with the control. The experiments were repeated at least 3 times before statistical analysis.

