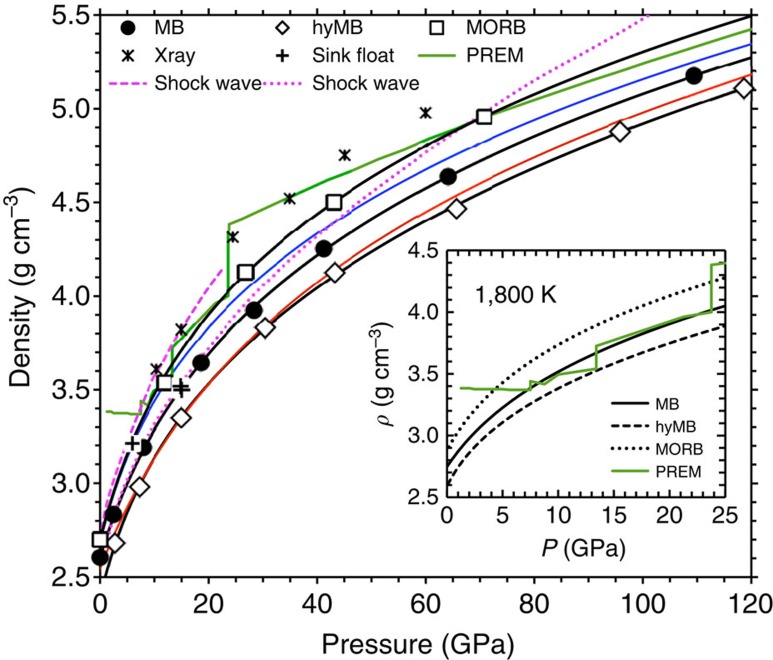
Figure 3. Melt density–pressure profiles.
The calculated MB results are shown as the fourth order Birch–Murnaghan isotherms along 2,200 K (blue line), 3,000 K (black line with circles) and 4,000 K (red line). The results for hydrous MB (hyMB, black line with diamonds) and MORB (black line with squares) are along 3,000 K isotherms. The calculated densities are compared with the seismic data (PREM: Preliminary Reference Earth Model (ref. 32)). Various experimental data are shown for comparisons: X-ray diffraction data (asterisks) at 2200–3273 K (ref. 9), sink-float data (crosses) at 1,673 K and 5.9 GPa (ref. 26) and at 2,473–2,773 K and 15 GPa (ref. 27) for basalt/MORB composition, shock-wave isentrope measured for MB applied to basaltic composition (dashed lines) from ref. 7, and shock-wave 1,673 K isotherm for MB (dotted lines) from ref. 8. The inset compares the calculated density at 1,800 K of three melts with the mantle density (PREM) in the low-pressure regime.

