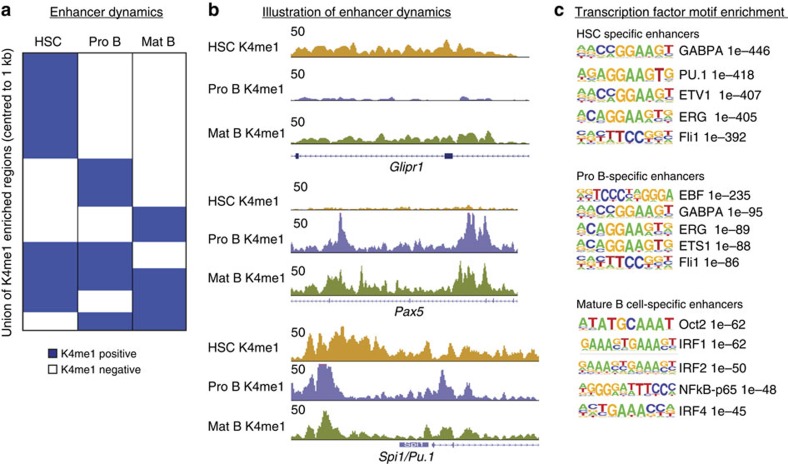
Figure 2. Enhancer repertoires are dynamically reshaped from HSCs to mature B cells.
(a) Heatmap showing the dynamic behaviour of the H3K4me1 mark in HSCs, Pro B and mature B cells. H3K4me1-positive regions are shown in blue, H3K4me1-negative regions in white. (b) Genome browser snapshot illustrating different kinds of cell type-specific enhancers: marked in HSCs and mature B but not in Pro B cells (top, Glipr1 locus), marked in Pro B and mature B cells but not in HSCs (middle, Pax5 locus) or marked in all stages (bottom, Spi1/Pu1 locus). (c) TF motif enrichments for enhancers specific to HSCs, Pro B or mature B cells. Sequence logos and P values are shown for the most highly enriched sequence motifs. Only motifs corresponding to TFs that are expressed in the respective cell type are shown (only ETS1 in HSCs and Oct4 in mature B cells were excluded).

