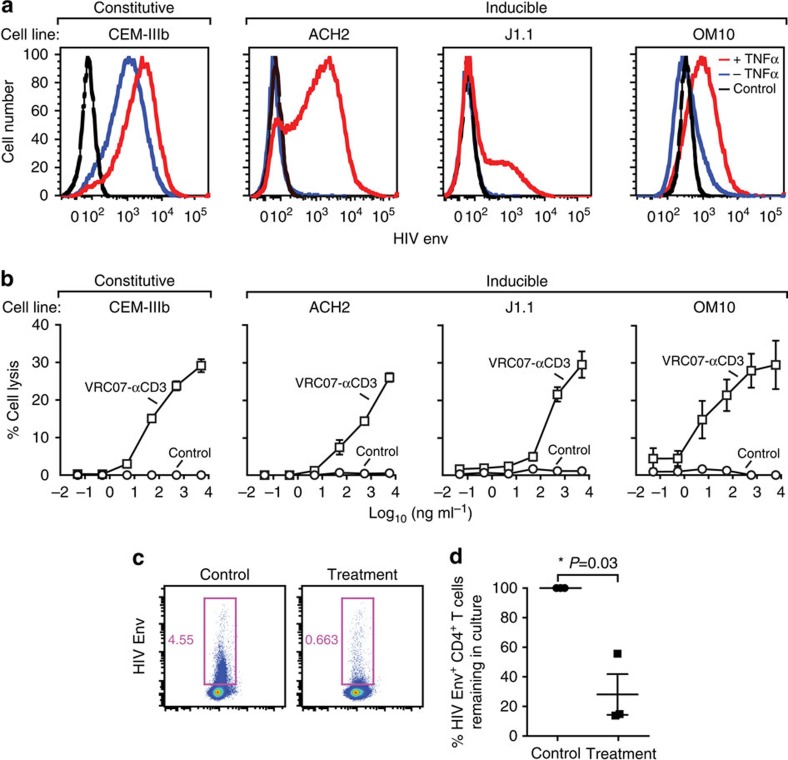
Figure 3. Activation and targeted lysis of chronic and latent HIV-infected cells by VRC07-αCD3.
(a) Induction of HIV in latent cell lines. Latent cell lines (ACH2, J1.1 and OM10) and a chronic cell line (CEM-IIIb) were cultured in the absence or presence of TNF-α for 14– 16 h and the expression of HIV Env on the cell surface using an allophycocyanin (APC)-conjugated 2G12 was measured using flow cytometry. The increase in the expression of HIV Env indicates the inducible expression in the latent cell lines compared with the constitutive expression in the chronic cell line. (b) Targeted lysis of HIV-infected cell lines by VRC07-αCD3. The indicated chronic and latent HIV-infected cell lines were co-cultured with enriched human T cells in the presence of increasing concentrations of VRC07-αCD3 or the indicated mutant control proteins for 14–16 h and per cent lysis of the infected cell line was measured using flow cytometry after staining with a live/dead cell marker. All three monospecific or double-negative controls gave similar results and therefore only one control (double negative) antibody is shown. Representative data from three independent experiments are shown, with each experiment performed with three technical replicates. Error bars indicate the s.e. at each concentration. (c,d) Reduction in the number of latently infected primary CD4+ T cells. Resting CD4+ T cells were enriched from PBMCs and infected with HIV-1 BaL after culture in the presence of CCL19 for 3 days. These CD4+ T cells were then co-cultured with allogeneic CD8+ T cells in the presence of VRC07-αCD3 or the double-negative control protein for 14–16 h. The expression of HIV Env on the surface of CD4+ T cells was then measured by flow staining with a fluorescently labelled 2G12 antibody. Representative data from one donor are shown in c, and data from three independent donors showing a statistically significant reduction (P=0.03, paired two-tailed t-test) in HIV Env+ CD4 T cells in the presence of the immunomodulatory proteins is plotted in d. The mean value is plotted and the error bars represent the s.e.

