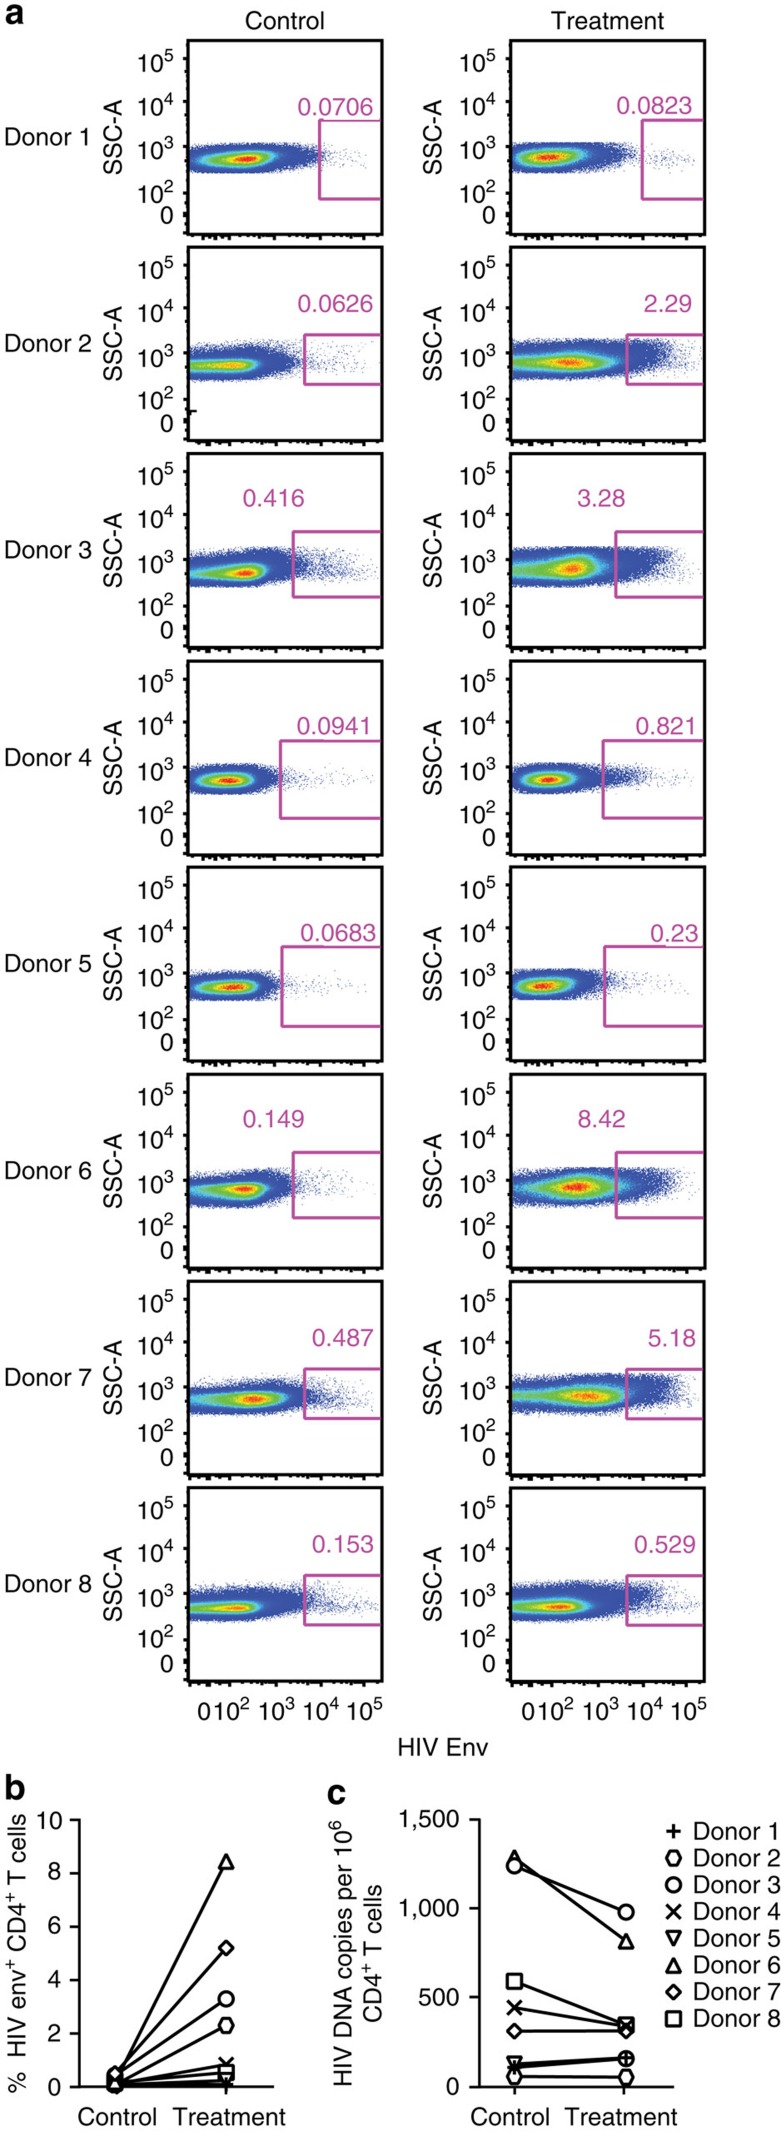
Figure 4. Activation and reduction in the number of latently infected CD4+ T cells ex vivo.
PBMCs obtained from eight HIV-1-infected donors on ART were incubated with the VRC07-αCD3 (Treatment) or a control-bispecific protein that has an active anti-CD3 arm but lacks active VRC07 Fab binding (Control) for 2 days. (a) The expression of cell surface HIV Env on live CD4+ T cells was detected on day 2 by flow cytometry using an APC-conjugated PGT121 antibody, and the plots for expression of HIV Env on live CD4+ T cells for all eight donors are shown. (b) The surface expression of HIV Env in control versus treatment groups on day 2 are plotted for each donor. The levels were normalized to the total percentage of CD4+ T lymphocytes in the live CD3+ T lymphocyte population as determined using flow cytometric analysis. (c) The live CD4+ T cells on day 2 were also sorted by FACS and the levels of HIV gag DNA in this population was quantitated by real-time PCR. The levels of HIV gag DNA in control versus treatment groups are plotted for each donor after normalization for cell numbers by detection of a housekeeping gene (albumin) in the real-time PCR assay. Because each assay is standardized separately, comparisons can be made within each group but not between them, for example, they do not reflect the per cent of Env+ cells relative to those containing proviral DNA.

