
Fig. 3. Peptidoglycan composition of LMW PBP mutants.
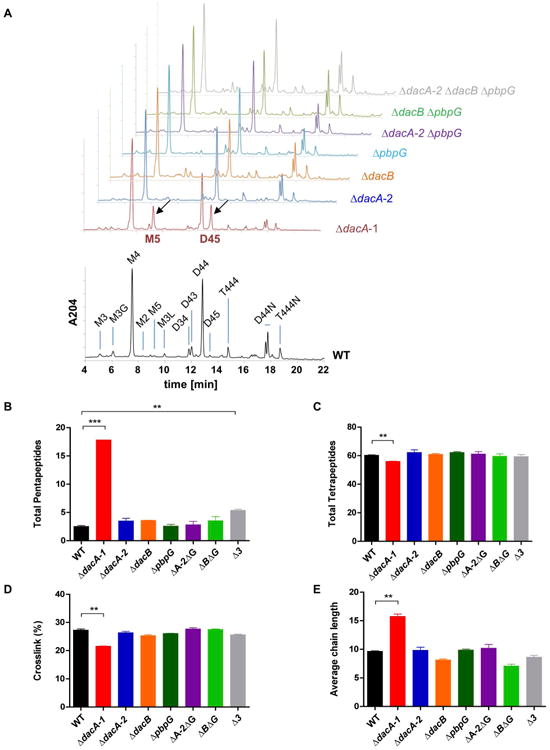
A. UPLC analysis of PG from wild-type (WT), ΔdacA-1, ΔdacA-2, ΔdacB, ΔpbpG, ΔdacA-2ΔpbpG, ΔdacBΔpbpG, and ΔdacA-2ΔdacBΔpbpG (Δ3) V. cholerae. Graphs were normalized by scaling the chromatograms relative to the maximum intensity measured in each run. Key peaks containing pentapeptides are marked with arrows. B, C. Comparison of the relative molar abundance of total pentapeptide (B) or tetrapeptide (C) moieties in the PG of the indicated strains. D. Crosslinking levels (%) in PG from the indicated strains. E. Average chain length based on the amount of anhydro-muropeptides. Relative amounts of muropeptides were calculated as described by Glauner (Glauner, 1988). The values are the means of two independent experiments. Error bars represent standard deviation of the mean. Stars indicate statistically significant differences based on unpaired t-test (**p£ 0.01, ***p£ 0.001).