
Fig. 4. The ΔdacA-1 phenotype is dependent on salt concentration.
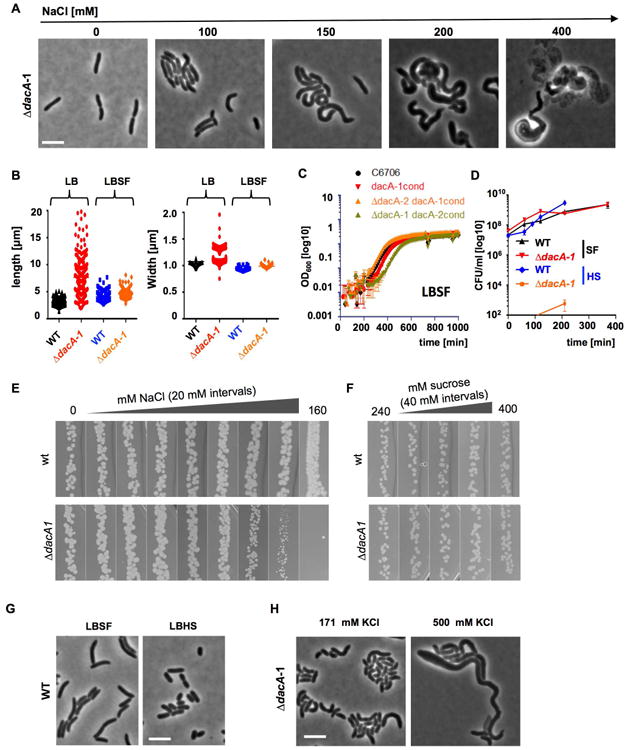
A. Phase contrast images of ΔdacA-1 cells grown to exponential phase in salt-free LB, then transferred to and grown for 4h in LB with different NaCl concentrations. B. Length and width of wt and DdacA-1 V. cholerae grown in LB or salt free LB (LBSF). At least 500 cells were measured for each condition using Microbe Tracker (Sliusarenko et al., 2011). Growth of wild type V. cholerae and the indicated conditional mutants in LBSF in the absence of inducer. Cells were precultured in LB containing arabinose. C. Growth curves of wt V. cholerae and strains lacking DacA-1 or DacA-1 and DacA-2 in LBSF lacking arabinose. Values represent the mean and SEM of at least three replicates. D. CFU of wild-type and ΔdacA-1 strains precultured in LBSF, then grown in LBSF or LB containing 500mM NaCl (LBHS), followed by plating on salt-free LB agar. E, F. Cultures were grown overnight in LBSF, then diluted in the same medium. For all conditions but 160mM NaCl, 20 ml of a 10−6 dilution was spotted on LB agar plates containing the indicated salt (E) or sucrose (F) concentrations. For plates containing 160 mM NaCl, 20 ml of a 10−5 dilution was spotted. G. Phase contrast images of wild-type cells grown as in (A). H. Phase contrast images of ΔdacA-1 cells grown in LBSF supplemented with 171 mM KCl or 500 mM KCl.