Figure 6.
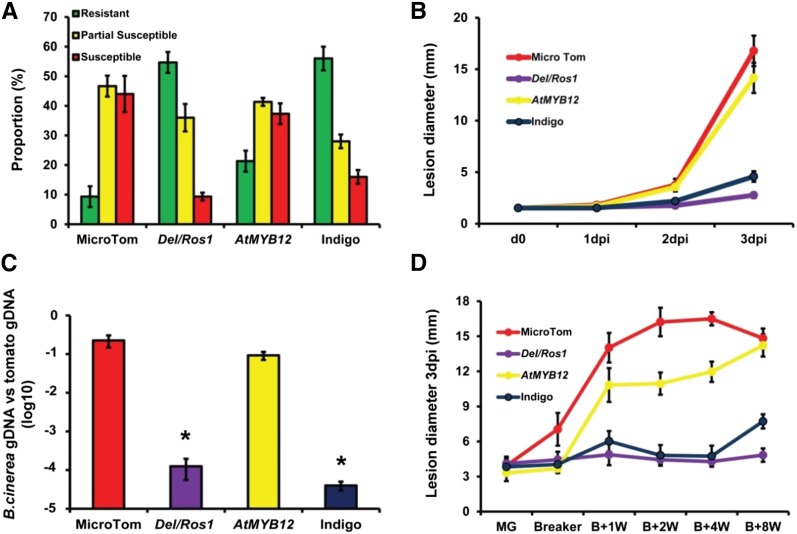
AtMYB12 tomatoes are susceptible to B. cinerea. A, Different degrees of susceptibility to B. cinerea were shown by wild-type, AtMYB12, Del/Ros1, and Indigo fruit in spraying tests. Fruit were inspected at 5 dpi. Error bars represent se for three independent assays. Green bars show the percentage of resistant fruit, yellow bars show partially susceptible fruit, and red bars show susceptible fruit. B, Lesion development on wounded fruit infected with B. cinerea. Error bars represent se (n = 6). C, qPCR estimating the amount of B. cinerea growing on wounded, infected fruit at 3 dpi. B. cinerea growth was calculated by comparison of the ratio of B. cinerea DNA to tomato DNA. Error bars show se (n = 3). Asterisks indicate significant differences (P < 0.05) compared with MicroTom. gDNA, Genomic DNA. D, Ripening-related susceptibility of tomatoes enriched with different flavonoids to B. cinerea. Fruit of different flavonoids were harvested at different time points and inoculated with B. cinerea spores. Lesion sizes were measured at 3 dpi. Error bars represent se for three independent assays.

