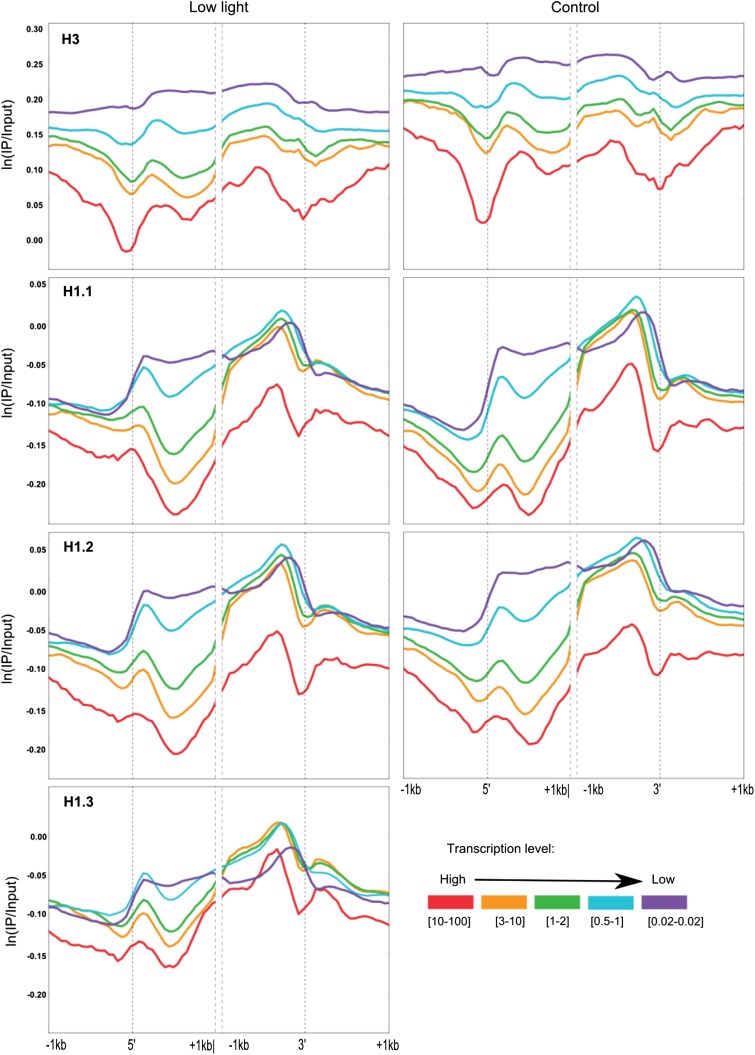
Figure 6.
Distribution of H1s and H3 within genes according to their levels of transcription in control conditions and low light. The signal for histone occupancy was plotted for 1 kb around both the 5′ (transcription start site [TSS]) and 3′ ends for five classes of genes divided according to their expression levels. IP, Immunoprecipitate.

