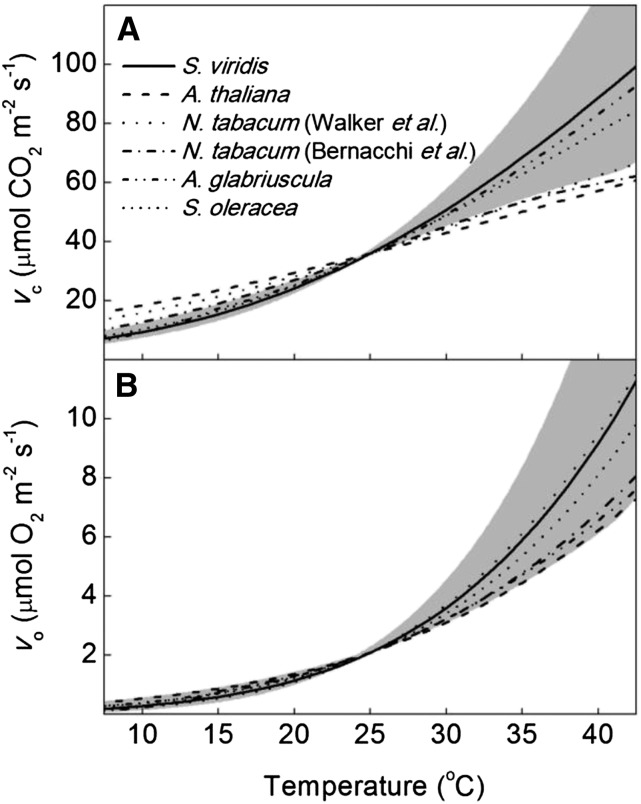
Figure 4.
Temperature responses of vc (A) and vo (B) modeled at pCO2 and pO2 expected at the site of Rubisco carboxylation in a C4 species (400 Pa of CO2 and 35 kPa of oxygen) compared with corresponding values from the literature normalized to S. viridis at 25°C. The solid lines are the modeled temperature responses of S. viridis from this report, with the 95% confidence intervals in gray. Dashed lines are temperature responses from previous reports normalized to S. viridis at 25°C (Badger and Collatz, 1977; Jordan and Ogren, 1984; Bernacchi et al., 2001, 2002; Walker et al., 2013). A Vcmax of 60 μmol m−2 s−1 was assumed.

