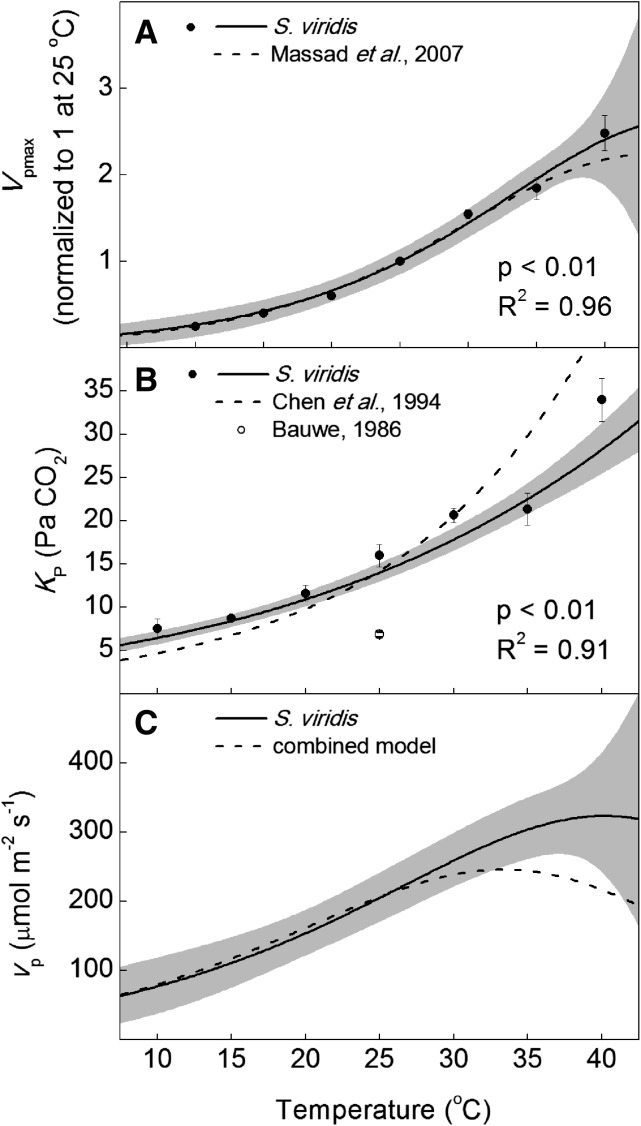
Figure 5.
Temperature response of PEPc parameters in S. viridis compared with corresponding temperature responses from the literature normalized to S. viridis at 25°C. The Vpmax (A), KP (B), and vp (C) were measured on crude leaf extracts with membrane inlet mass spectrometry. Calculations of KP assumed a constant leaf pH of 7.2 and a pKa appropriate for an ionic strength or 0.1 m (Jenkins et al., 1989), with a temperature dependency as described by Harned and Bonner (1945). The model of vp used a measured Vpmax of 450 μmol m−2 s−1 at 25°C and a constant mesophyll pCO2 of 12 Pa. The solid lines are the modeled temperature responses from this report (Table I), with 95% confidence intervals in gray. Dotted lines are the temperature responses for Vpmax for maize (Massad et al., 2007) and for KP (Chen et al., 1994) normalized to S. viridis at 25°C. Black circles are the means of three biological replicates ± se, and the white circle in B is the KP reported previously for maize ± se (Bauwe, 1986). P values refer to the significance of the temperature response from zero, and adjusted R2 values describe the amount of variation in the measured parameter explained by the model.

