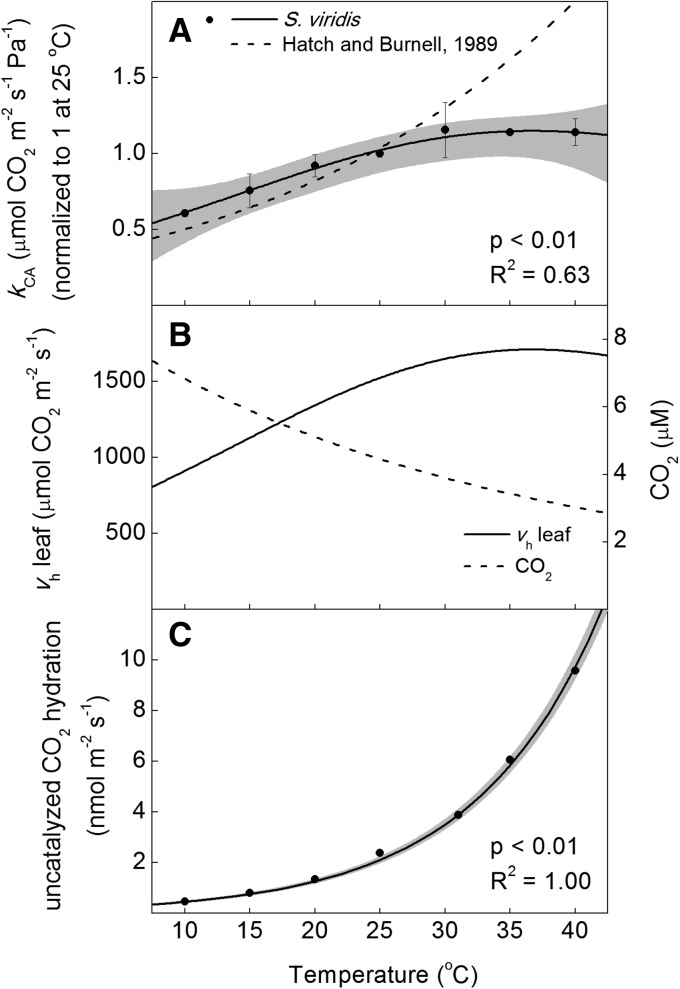
Figure 6.
Temperature responses of CA parameters in S. viridis. A, The kCA was measured on crude leaf extracts using membrane inlet mass spectrometry and is compared with a previously published maximum hydration rate from maize (Hatch and Burnell, 1990) normalized at 25°C. B, The kCA from S. viridis was used to calculate leaf CA activity (vh; solid line) assuming a constant 12 Pa of CO2 above the liquid phase and the temperature-dependent change in dissolved CO2 (dashed line). C, Temperature responses of the uncatalyzed CO2 vh for the mesophyll cytosol calculated assuming a cytosol volume of 30 μL mg−1 chlorophyll (Badger and Price, 1994) and 200 mg chlorophyll m−2 leaf tissue at a constant 12 Pa of CO2. Black circles represent average values of three biological replicates, each with three technical replicates per temperature, ± se (n = 3). The solid lines represent models fit to measured data (Table I), with the 95% confidence intervals shown in gray. Calculations of the catalyzed and uncatalyzed vh account for changes in pH and CO2 that occurred when measuring at different temperatures (Supplemental Fig. S1); however, it was assumed that the pH of the mesophyll cytosol was buffered at 7.2. P values refer to the significance of the temperature response from zero, and adjusted R2 values describe the amount of variation in the measured parameter explained by the model.

