Figure 1.
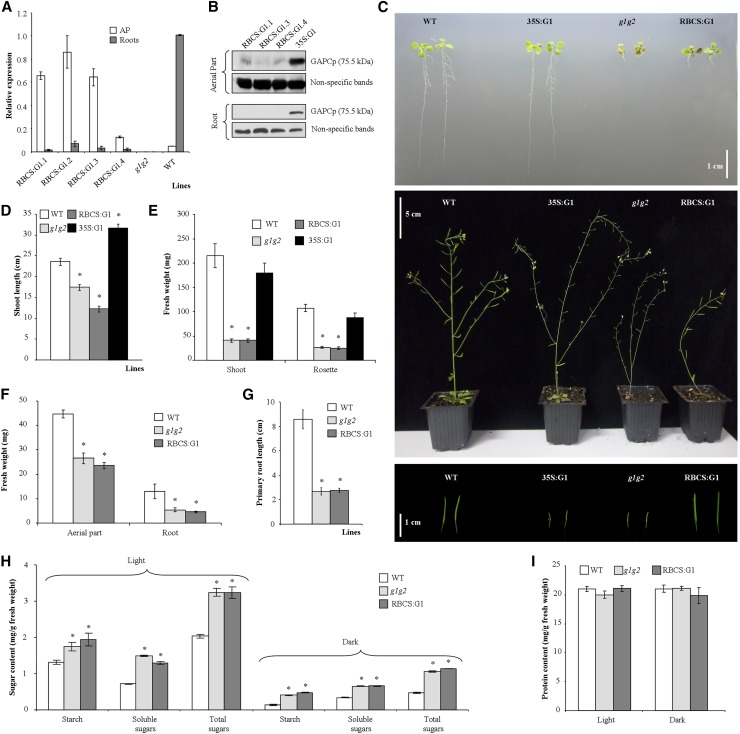
Molecular and phenotypical analysis of gapcp1gapcp2 (g1g2) expressing GAPCp1-GFP under the control of the RBCS promoter (RBCS:G1). A, qRT-PCR analysis of GAPCp1 in the APs and roots of several 18-d-old RBCS:G1 lines as compared with the wild type (WT) and g1g2. B, Immunoblot showing GAPCp1 expression in the APs and roots of three representative RBCS:G1 lines as compared with g1g2 expressing GAPCp1 under the control of the 35S promoter (35S:G1). Protein gel-blot analysis was performed using anti-GFP antibodies. Nonspecific bands are shown as a sample loading control at bottom. C, Morphology of seedlings (top), adult plants (middle), and siliques (bottom) from wild-type, 35S:G1, g1g2, and RBCS:G1 plants. D and E, Shoot length (D) and fresh weight of shoots and rosette leaves (E) of plants grown in the greenhouse. F to I, Fresh weight (F), root length (G), starch and total soluble sugar contents (H), and protein content (I) of wild-type, g1g2, and RBCS:G1 lines grown for 18 d on plates. In A, H, and I, values are means ± se of three independent biological replications. In D to G, values are means ± se of three independent transgenic lines (n ≥ 36 plants). Asterisks indicate significant differences as compared with the wild type (P < 0.05).

