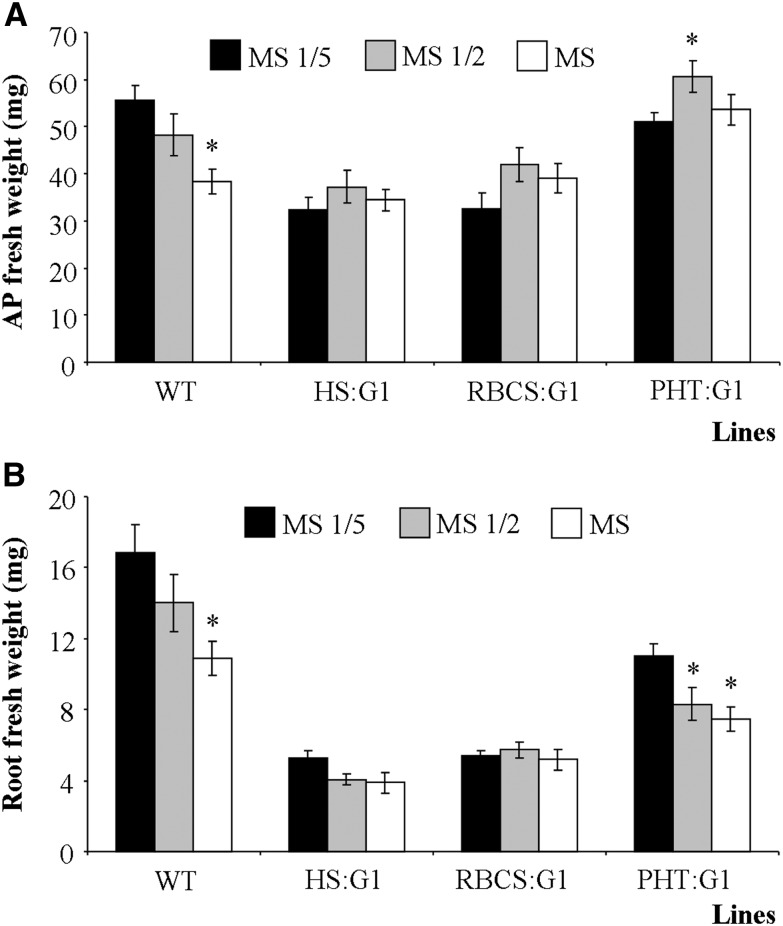
Figure 5.
Growth parameters of gapcp1gapcp2 lines grown in medium with increasing MS medium concentrations. Fresh weights of the AP (A) and roots (B) of 21-d-old wild type (WT) and gapcp1gapcp2 plants expressing GAPCp1 (G1) under the control of the HS (HS:G1), the RBCS (RBCS:G1), and the PHT (PHT:G1) promoters are shown. Values are means ± se of two independent transgenic lines (n ≥ 36 plants). Asterisks indicate significant differences as compared with plants grown in one-fifth-strength MS medium (P < 0.05).

