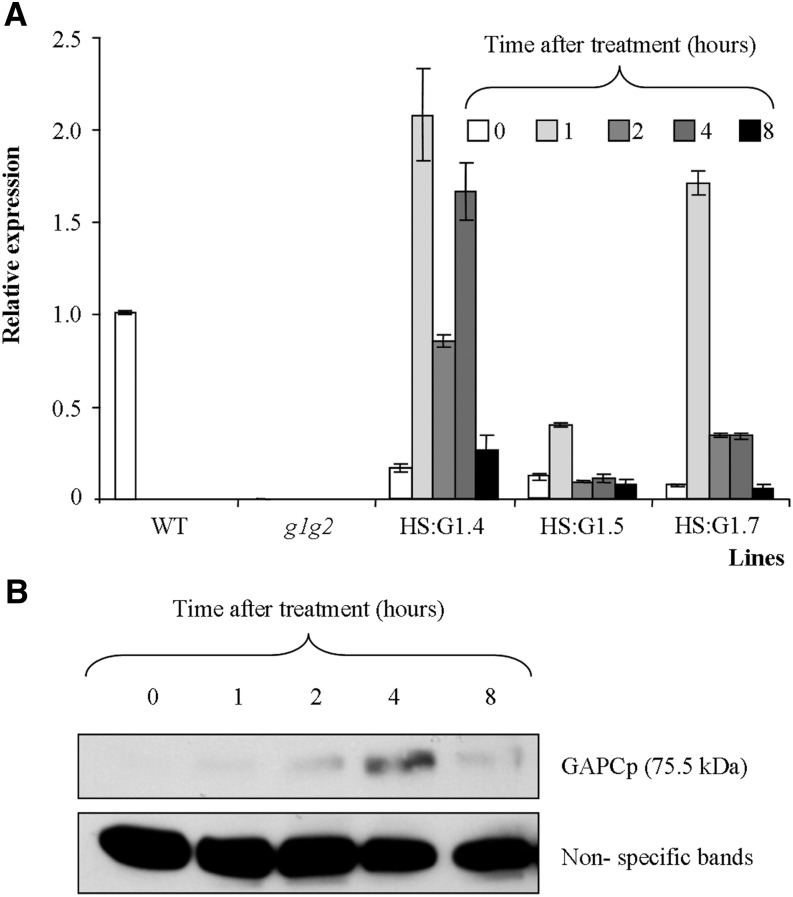
Figure 6.
Molecular and phenotypical analyses of gapcp1gapcp2 (g1g2) expressing GAPCp1-GFP (G1) under the control of the HS promoter (HS:G1). A, Time-course analysis of GAPCp1 mRNA expression in three 18-d-old HS:G1 lines as compared with the wild type (WT) and g1g2. B, Time-course analysis of GAPCp1 protein expression in HS:G1 lines. Protein gel-blot analysis was performed using anti-GFP antibodies. Nonspecific bands are shown as a sample loading control at bottom. In A, values means ± se of three independent biological replications.

