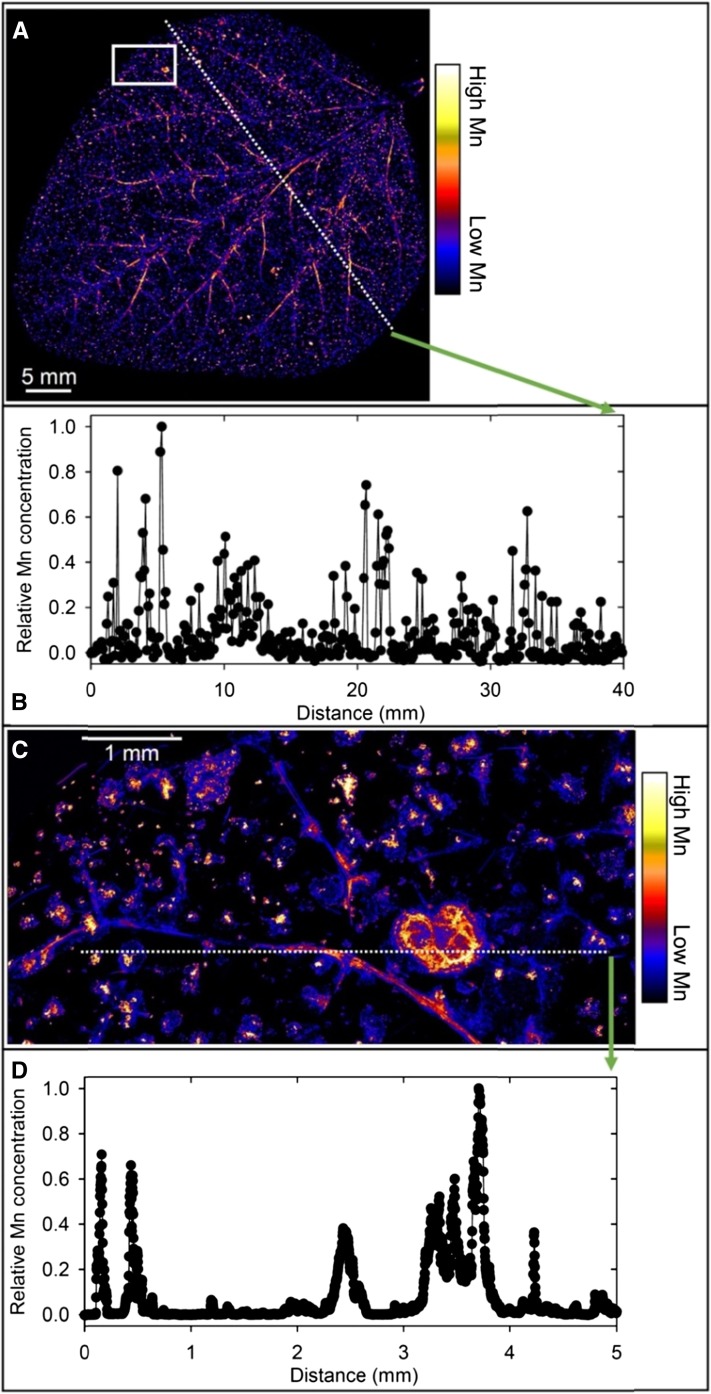
Figure 2.
Compton-corrected µ-XRF images of Mn in a leaf of a soybean plant grown for 16 d at 100 µm Mn. A, Overview of a whole leaf illustrating Mn distribution along major veins and in localized areas. B, Relative Mn concentration along the transect identified in A. C, Detailed Mn distribution in a leaf section identified by the white box in A. D, Relative Mn concentration along the transect identified in C illustrating Mn accumulation in localized necrotic areas and in or near the veins.

