Figure 4.
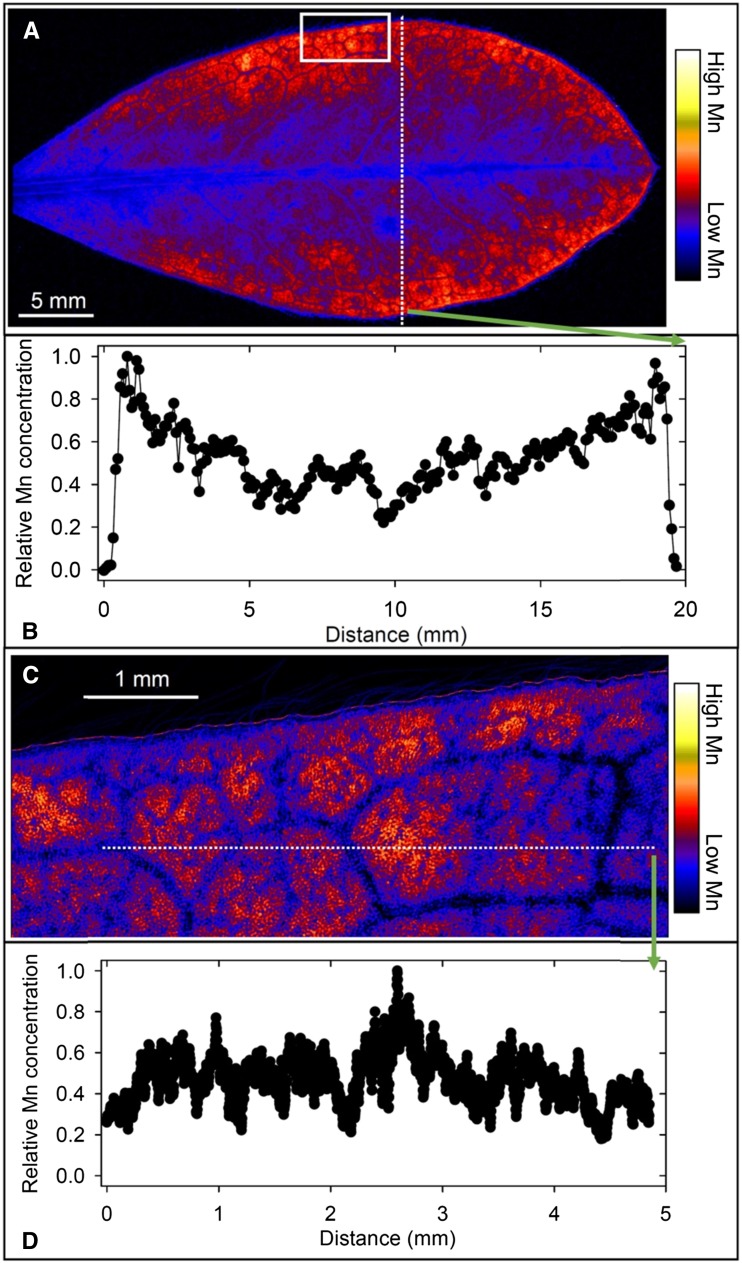
Compton-corrected µ-XRF images of Mn in a leaf of a white lupin plant grown for 16 d at 100 µm Mn. A, Overview of a whole leaf illustrating higher Mn toward the leaf edge. B, Relative Mn concentration along the transect identified in A illustrating the increase from the midvein to the leaf edge. C, Detailed Mn distribution in a leaf section identified by the white box in A, with low Mn near the veins and high Mn in the interveinal areas. D, Relative Mn concentration along the transect identified in C illustrating the variation near the leaf edge.

