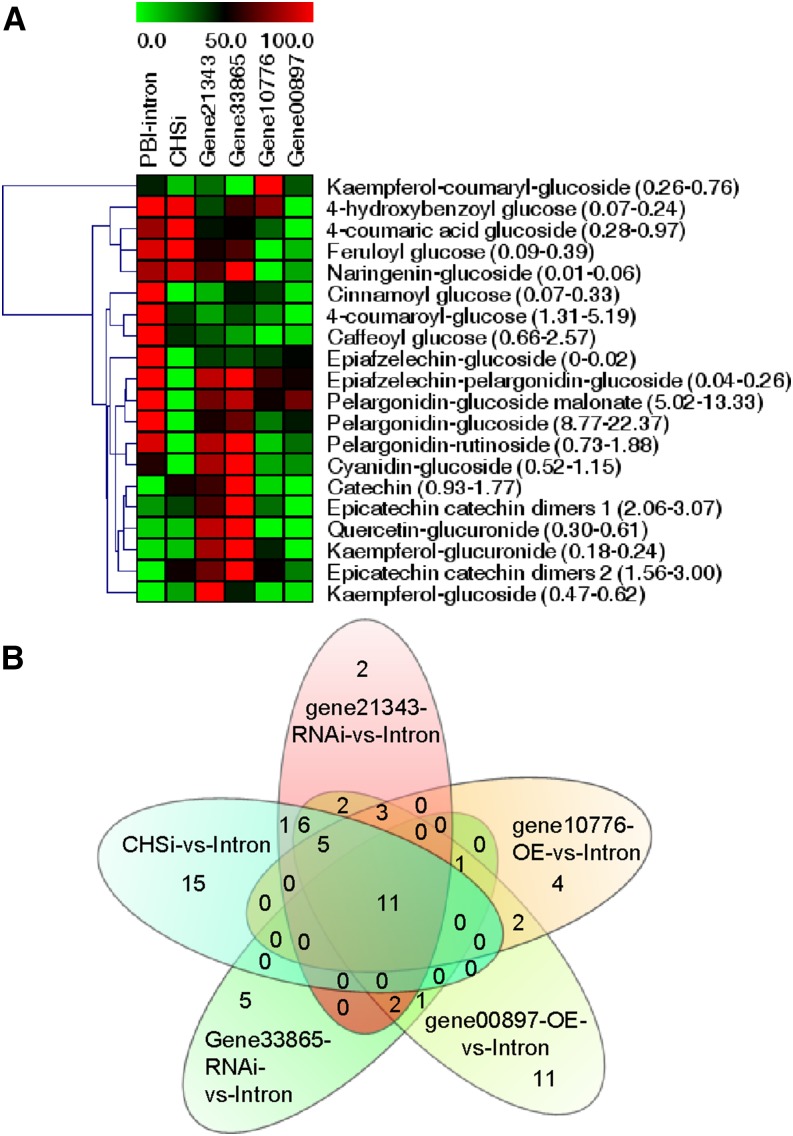
Figure 2.
Targeted metabolite analysis and Venn diagram. Targeted metabolite analysis (A) and Venn diagram (B) showing the results of the second order analysis of untargeted LC-MS data. Metabolites were extracted from Fragaria spp. fruits in which the candidate genes were differentially expressed due to agroinfiltration of RNAi and overexpression (OE) constructs, using chalcone synthase RNAi constructs (CHSi) as positive control. Heat map also shows the range of concentration of the individual metabolites in parenthesis. Second order (meta-)analysis was performed according to Tautenhahn et al. (2011).

