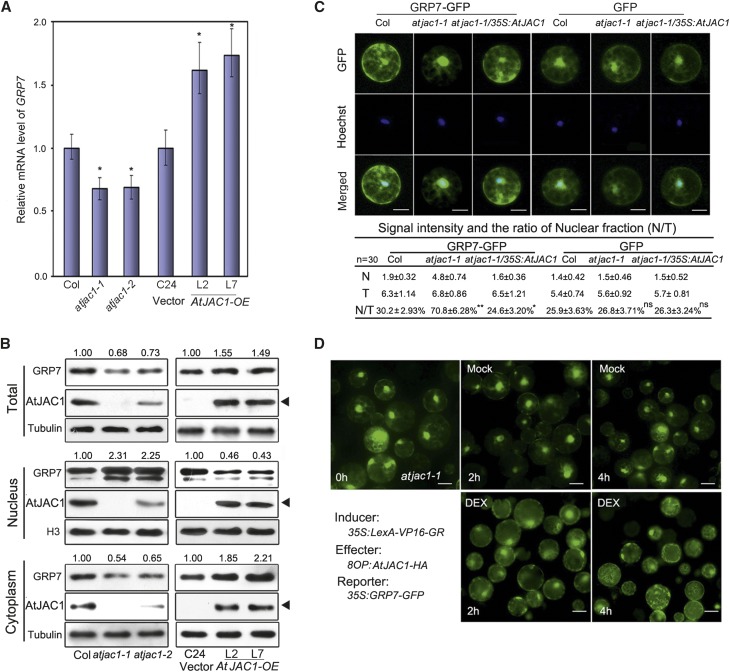
Figure 4.
AtJAC1 inhibits the nuclear accumulation of GRP7. A, GRP7 transcription was up-regulated in AtJAC1-OE lines and down-regulated in the atjac1 mutant. Student’s t test was performed; atjac1 mutants were compared with Col, whereas AtJAC1-OE lines were compared with C24 (vector): *, P < 0.05. B, Immunoblotting of GRP7 protein in atjac1 mutant and AtJAC1-OE transgenic lines. Tubulin is shown as a loading control for total protein and cytoplasmic fractions, and H3 shows loading for the nuclear fraction. Black triangles indicate AtJAC1-GFP (transgene) bands. Relative fold changes of GRP7 were quantified using ImageJ (http://rsb.info.nih.gov/ij). Experiments were repeated with three batches of independent materials. C, Quantification of GRP7-GFP distribution to the nucleus in protoplasts. The fluorescence intensities (106×) and the ratio between the nucleus and the total (N/T) in each type of protoplast are shown below the images. N, Nuclear signal; T, total signal. Data are means ± sd of 30 individual cells of one transformation; three different transformations were done in total. Hoechst staining indicates the nucleus area. Statistical analysis was done by Student’s t test; GRP7-GFP or GFP intensity in atjac1-1 or atjac1-1/35S:AtJAC1 were compared with Col: *, P < 0.05; **, P < 0.01; ns, no significant change. Bars = 10 μm. D, DEX-induced expression of AtJAC1 accelerated the spread of nucleus-localized GRP7-GFP to the cytoplasm in atjac1-1 protoplasts. DEX, Treatment with solution containing 10 µm DEX; Mock, treatment with solution without DEX reagent. Bars = 15 μm.

