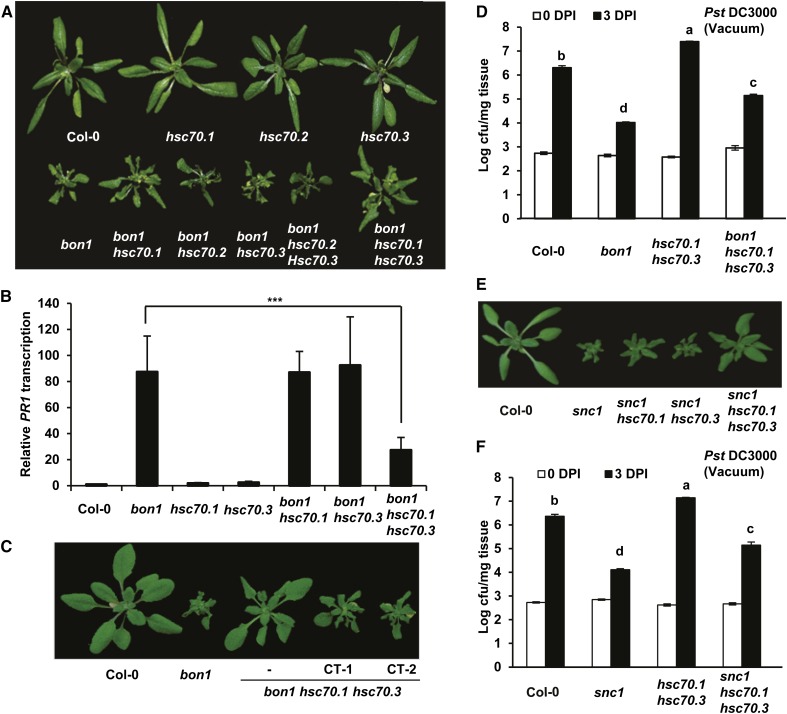
Figure 4.
Mutations in HSC70.1 and HSC70.3 partially suppress the bon1 and snc1 phenotypes. A, Partial rescue of the bon1 growth phenotype by the hsc70 mutations. Shown are 40-d-old plants of Col-0, hsc70.1, hsc70.2, hsc70.3, bon1, bon1 hsc70.1, bon1 hsc70.2, bon1 hsc70.3, bon1 hsc70.2 hsc70.3, and bon1 hsc70.1 hsc70.3. B, Down-regulation of PR1 gene expression in bon1 by hsc70 mutations. Shown are relative expression levels of the PR1 gene in Col-0, bon1, hsc70.1, hsc70.3, bon1 hsc70.1, bon1 hsc70.3, and bon1 hsc70.1 hsc70.3 assayed by qRT-PCR. Error bars represent sds (Student’s t test; ***, P < 0.001). C, Complementation test of bon1 hsc70.1 hsc70.3 mutant. Shown are Col-0, bon1, bon1 hsc70.1 hsc70.3, and two independent complementation transgenic (CT) T2 lines (CT-1 and CT-2) of bon1 hsc70.1 hsc70.3 transformed with the genomic fragment of HSC70.1 in the vector pMDC99 (pMDC99:HSC70.1). D, Partial suppression of resistance against the virulent bacterial strain Pst DC3000 in bon1 by the hsc70 mutations. Shown is the growth of bacteria as log value of cfu per milligram tissue in Col-0, bon1, hsc70.1 hsc70.3, and bon1 hsc70.1 hsc70.3 via vacuum inoculation at 0 and 3 DPI. Values represent averages of three biological repeats, and error bars represent sds. Letters indicate statistical difference (P < 0.001; Bonferonni posttest) of different genotypes. E, Partial rescue of the snc1 growth defect by the hsc70 mutations. Shown are wild-type Col-0, snc1, snc1 hsc70.1, snc1 hsc70.3, and snc1 hsc70.1 hsc70.3 plants before bolting. F, Partial suppression of enhanced resistance against virulent bacterial pathogen Pst DC3000 in snc1 by the hsc70 mutations. Shown are bacterial growths in Col-0, snc1, hsc70.1 hsc70.3, and snc1 hsc70.1 hsc70.3 plants at 0 and 3 DPI. Letters indicate statistical difference (P < 0.001; Bonferonni posttest) of different genotypes.

