Figure 6.
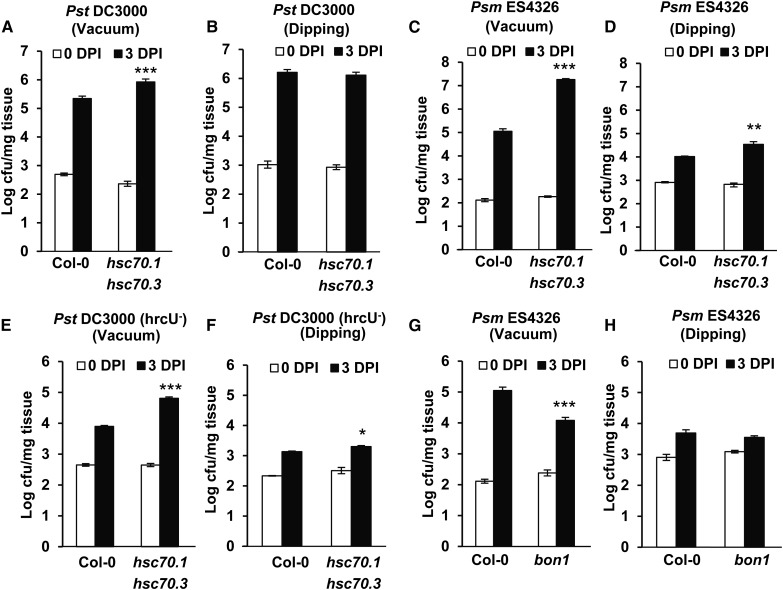
Comparing pathogen growth in hsc70.1 hsc70.3 and bon1 mutants with different inoculation methods. A to F, Pathogen growth of Pst DC3000 (A and B), Psm ES4326 (C and D), and Pst DC3000 hrcU– (E and F) in Col-0 and the hsc70.1 hsc70.3 mutant by vacuum (A, C, and E) or dipping (B, D, and E) inoculations at 0 and 3 DPI. G and H, Pathogen growth of Psm ES4326 in Col-0 and the bon1-1 mutant by vacuum (G) or dipping (H) inoculations at 0 and 3 DPI. Values represent averages of three biological repeats, and error bars represent sds. A star indicates a statistical difference from the wild type (Student’s t test; *, P < 0.05; **, P < 0.01; and ***, P < 0.001).

