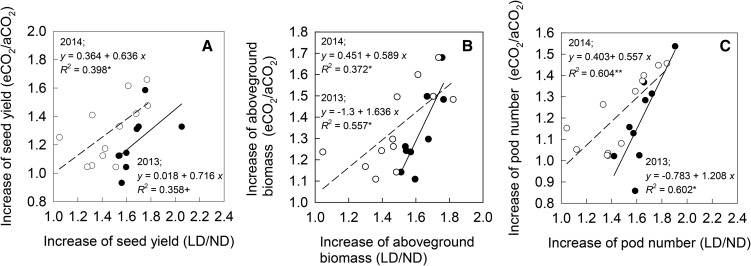
Figure 3.
Linear regressions for the relationships between the ratio of the values at eCO2 to that at aCO2, and the ratio of the value at LD to that at ND for seed yield (A), aboveground biomass (B), and pod number (C) in 2013 (black circles) and 2014 (white circles). **, P < 0.01; *, P < 0.05; +, P < 0.1.

