Figure 1.
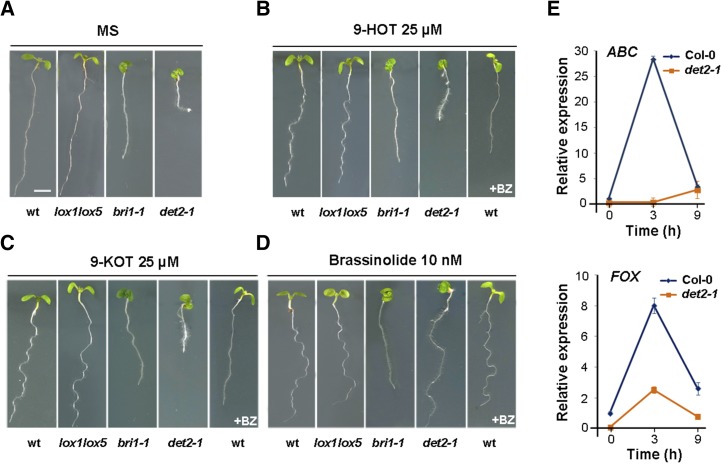
Response of wild-type (wt), lox1lox5, bri1-1, and det2-1 plants to 9-HOT, 9-KOT, and BL. A, Phenotypes of plants grown on MS medium (3 d) and transferred to fresh MS control medium (4 d). B, Phenotypes of plants grown on MS medium (3 d) and transferred to MS medium containing 9-HOT (25 μm; 4 d). At right, the phenotype of wild-type plants transferred to MS medium containing 9-HOT (25 μm) and brassinazole (BZ; 1 μm) is shown. C, Phenotypes of plants grown on MS medium (3 d) and transferred to MS medium containing 9-KOT (25 μm; 4 d). At right, the phenotype of wild-type plants transferred to MS medium containing 9-KOT (25 μm) and BZ (1 μm) is shown. D, Phenotypes of plants grown on MS medium (3 d) and transferred to MS medium containing BL (10 nm; 4 d). At right, the phenotype of wild-type plants transferred to MS medium containing BL (10 nm) and BZ (1 μm) is shown. Bar in A = 250 μm. E, ABC and FOX expression in wild-type Columbia-0 (Col-0) and det2-1 plants determined by quantitative reverse transcription (RT)-PCR analysis in RNA samples extracted at different times from 25 μm 9-KOT-treated seedlings. The gene At1g43170 encoding Ribosomal protein L3A was used to normalize transcript levels in each sample. Data shown are mean ± se of three independent experiments.

