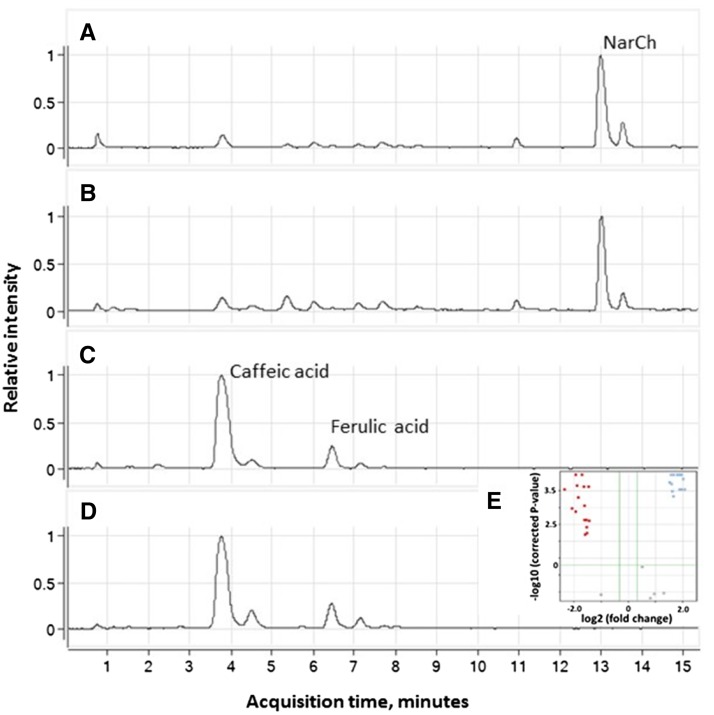
Figure 2.
LC-MS analysis of fruit rind methanol extracts after enzymatic hydrolysis. A to D, Base peak chromatograms of mass range mass-to-charge ratio 100 to 1,000 in ESI negative mode. A, NA parent. B, Bulk of yellow F3. C, TVT parent. D, Bulk of white F3. E, A volcano plot indicating specific compounds that differentially accumulated (P < 0.05; minimum 10-fold difference) in the NA and yellow F3 group (red) or the TVT and white F3 group (blue).

