Figure 4.
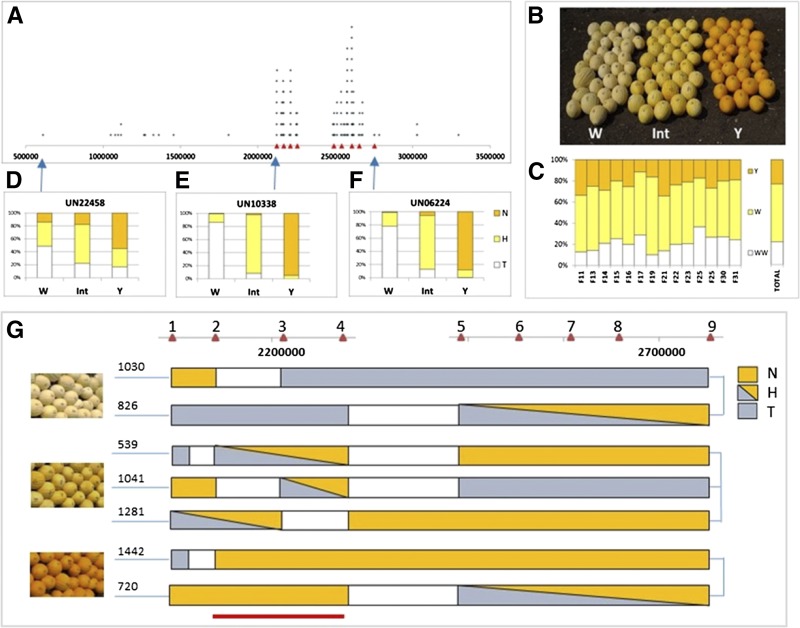
Genetic mapping of the locus governing flavonoid accumulation. A, Physical positions of the 164 of 179 SNPs that significantly differentiated between the bulks on scaffold 16 of the muskmelon genome. Red triangles represent positions of nine selected HRM markers. B, Phenotypes of individual F3 fruits included in the recombinants analysis: white (W), pale yellow (Int), and yellow (Y) fruit. C, Segregation (percentage) of Y, Int, and W phenotypes within each of the 14 F3 families and among all analyzed individual F3 plants (total). D to F, Distribution of TVT (T), heterozygote (H), and NA (N) alleles of the three fluorescent SNP probes (UN22458, UN10338, and UN06224) within W, Int, and Y phenotypes of individual F3 plants; the physical position of each probe is indicated by a blue arrow. G, Fine mapping with the nine HRM markers (red triangles 1–9). Below are individual plants segregating to these HRM markers and exhibiting defined phenotypes (white, pale yellow, and yellow). The bottom red line indicates the 100-kb genomic region that shows 100% cosegregation of genotype and phenotype.

