Figure 6.
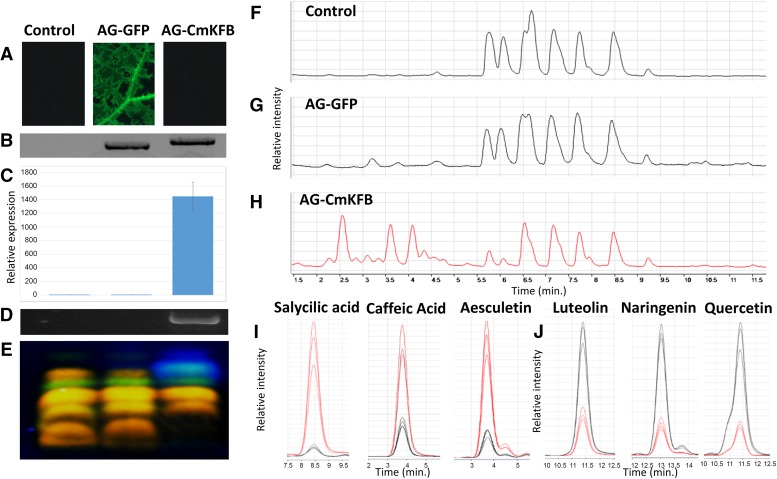
Virus-induced CmKFB expression in muskmelon leaves. A, Control (uninfected and VIGE GFP) and VIGE CmKFB leaves observed through a GFP filter under UV light. B, PCR amplification of the inserted cDNA products. C, CmKFB expression analyzed by qRT-PCR. D, PCR amplification of CmKFB CDS cDNA. E, TLC fractionation of leaf methanol extracts observed under UV after DPBA staining. F to H, Base peak chromatograms of mass range mass-to-charge ratio 100 to 1,000 measured in LC-MS. F, Uninfected control leaf. G, VIGE GFP leaf. H, VIGE CmKF leaf. I and J, Quantitative comparison of differentiating compounds in leaf methanol extract after enzymatic hydrolysis. Compounds were identified by comparisons with authentic standards. I, Up-regulated in VIGE CmKFB (red) compared with controls (black). J, Down-regulated in VIGE CmKFB (red) compared with controls (black).

