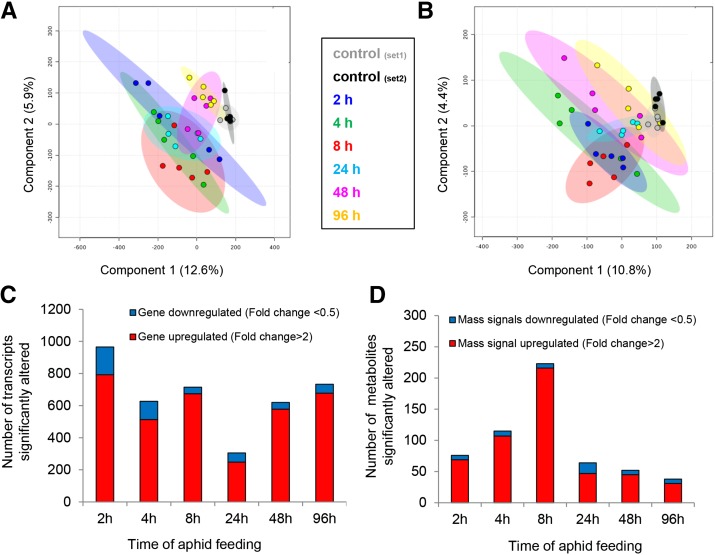
Figure 1.
Overview of maize transcriptome and metabolome responses to aphid feeding. A, PLS-DA plots of 1,607 genes identified by transcript profiling (RNA-Seq) of inbred line B73 infested with aphids for the indicated time periods. Ovals indicate 95% confidence intervals. B, PLS-DA of 319 mass signals (negative ion mode) identified by LC-TOF-MS. Ovals indicate 95% confidence intervals. Similar data for the positive ion mode are shown in Supplemental Figure S3. C and D, Number of individual transcripts and mass spectrometry features that were significantly up- or down-regulated at each time point, respectively. P < 0.05 (FDR adjusted), and fold change greater than 2 or less than 0.5.

