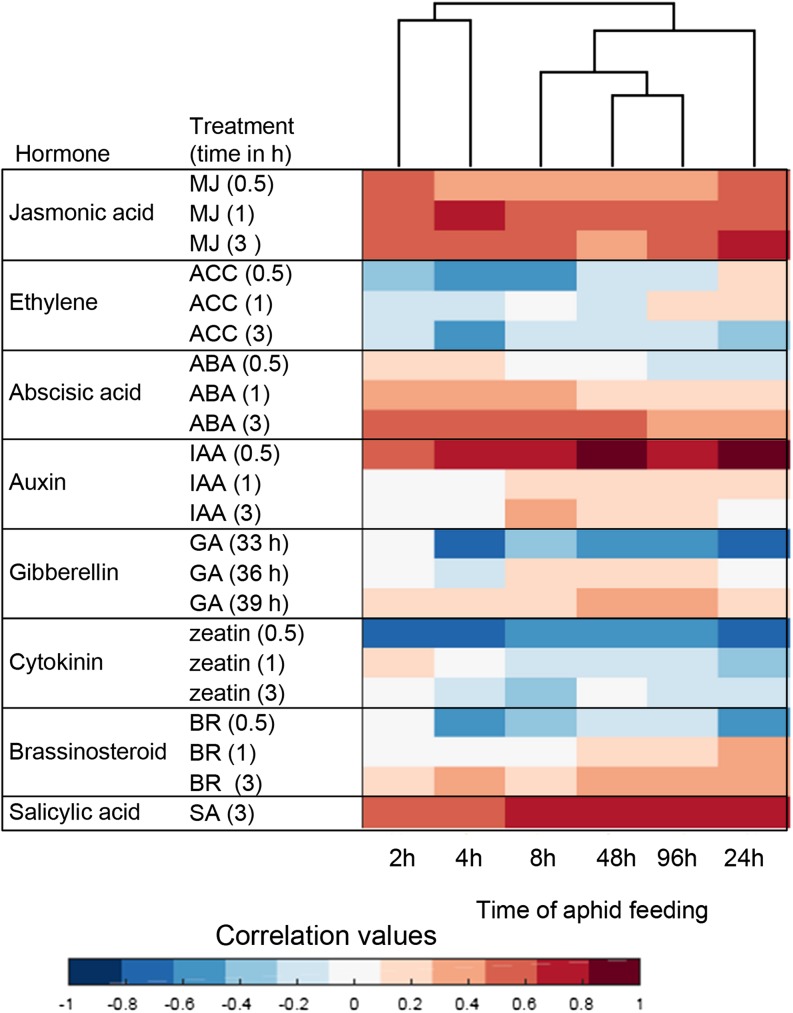
Figure 3.
Identification of plant hormone signatures based on transcriptomic data. The analysis was conducted using the Hormonometer program (Volodarsky et al., 2009). Red shading indicates a positive correlation between the maize aphid treatment and a particular hormone response; blue shading indicates a negative correlation. MJ, Methyl jasmonate; ACC, 1-aminocyclopropane-1-caroxylic acid (a metabolic precursor of ethylene); ABA, abscisic acid; IAA, indole-3-acetic acid, GA, GA3; BR, brassinosteroid; SA, salicylic acid.

