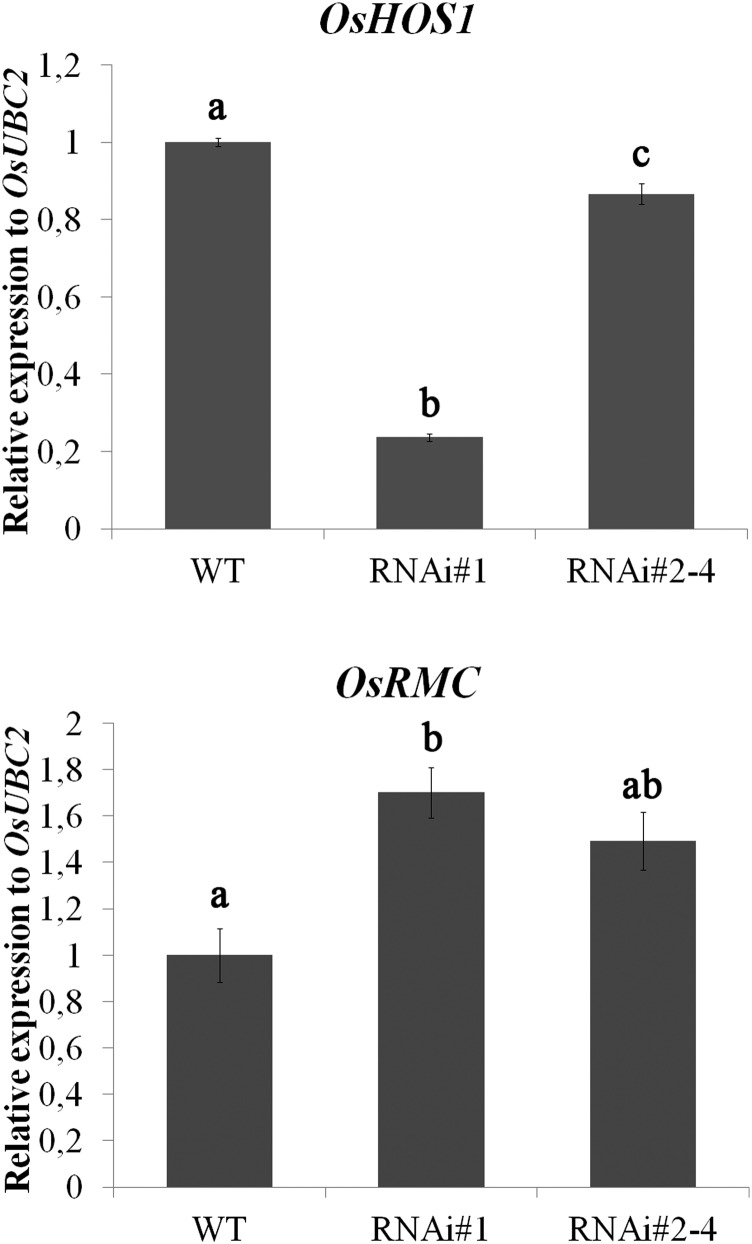
Figure 2.
Gene expression analyses for OsHOS1 (JQ866627) and OsRMC (LOC_Os04g25650) were performed by RT-qPCR in wild-type (WT) and RNAi::OsHOS1 silencing lines (#1 and #2–4) under control conditions. The specific primers are described in Supplemental Table S2. The transcript level for Ubiquitin-Conjugating Enzyme E2 (OsUBC2, LOC_Os02g42314) was used to normalize the expression as an internal control for the RT-qPCR. The expression value of the wild-type sample was set to 1. Values represent means ± se (n ≥ 5 biological samples from at least three independent experiments). Different letters above the columns represent significant statistical difference between the different lines using Tukey’s analysis (P < 0.05).

