Figure 2.
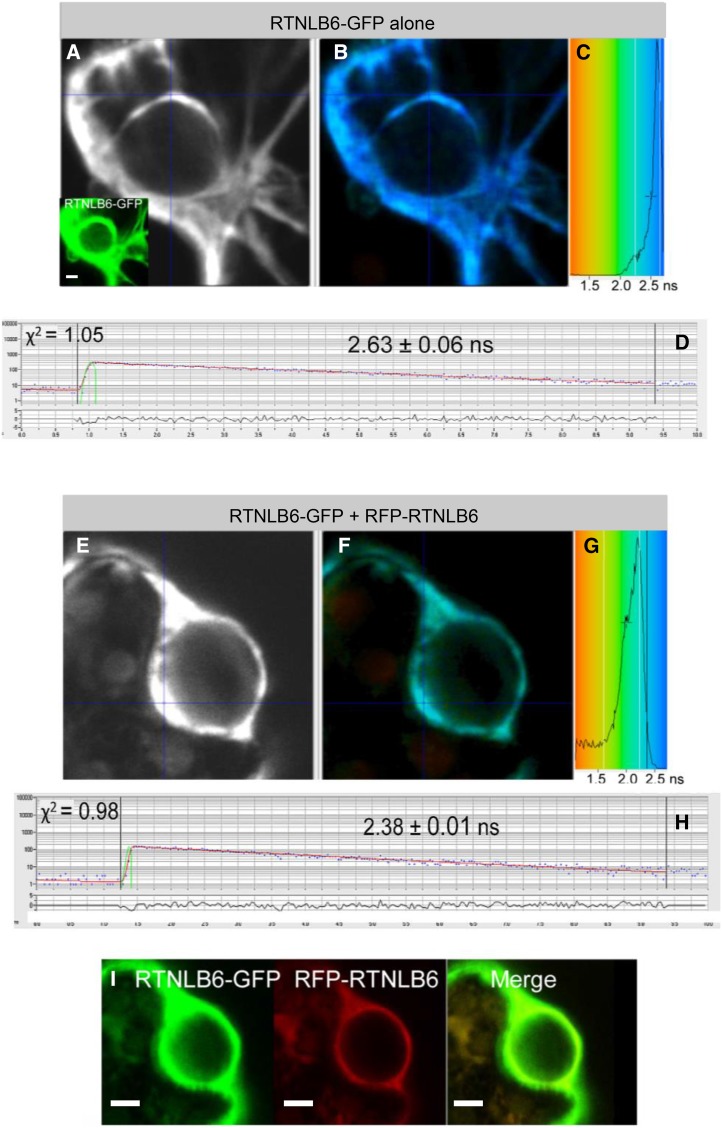
FRET-FLIM analysis of RTNLB6 without an interaction partner (A–D) or RTNLB6 dimerization (E–I). A and E display the raw FRET-FLIM data. In B and F, pseudocolored lifetime maps show the lifetime values for each point within the region of interest, while the distribution of lifetimes across the entire image is shown in C and G, with blue shades representing longer GFP fluorescence lifetimes than green ones. D and H display representative decay curves of a single point with an optimal single exponential fit, where χ2 values from 0.9 to 1.2 were considered an excellent fit to the data points (binning factor of 2). The inset in A and I are the respective confocal images for the analysis, showing the GFP construct in green and the mRFP construct in red. This example of FRET-FLIM analysis shows that RTNLB6 homodimerizes, because the lifetime values for the GFP/mRFP fusion pair (H; 2.38 ± 0.01 ns) are lower than those for the GFP fusion alone (D; 2.63 ± 0.06 ns). Bars = 5 µm.

